Musicbed
Filmsupply
Stills
Contact Us(800) 805-6802

Extreme macro close up of green and red candles with long wicks of user interface of trading application show the price of a stock or crypto currency going down with a negative trend symbolizing volatility and price action or movement
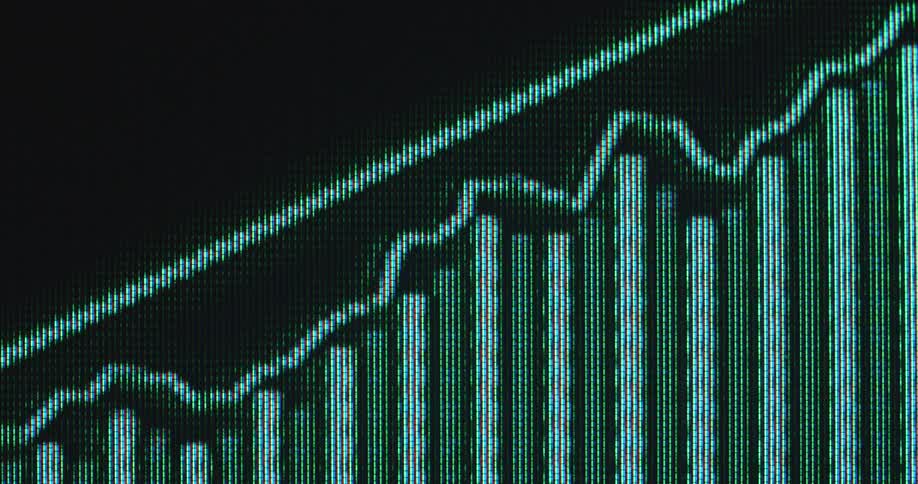
Extreme close-up on a pixelated screen shows a bar graph and arrow rising to represent business success and economic growth
A blue security stripe runs to the right of benjamin franklins head on a one hundred dollar bill
Closeup of a screen displaying numbers and percentages
A green digital chart features a sharply rising arrow indicating a strong upward trend and increasing profit due to a great performance of stock or crypto trading portfolio via an online platform or exchange
Close up of a line graph on a screen under a blue light while the camera comes on and off focus
Screen displaying bearish financial market graph as candlestick chart crashes while stock and crypto currency markets decline and assets lose their value due to drastically decreasing and falling prices causing panic sales and recession with volatility
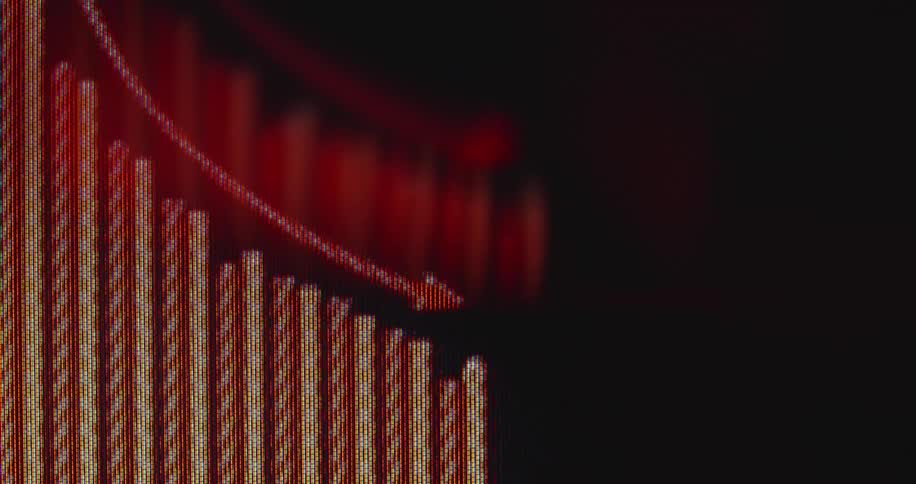
An animated red bar graph with a downward pointing arrow trends down, symbolizing economic recession
Blurry stock ticker numbers flash on a screen
A close-up, out-of-focus shot of a blue digital line graph fluctuating on a dark screen, representing stock market data or financial trends
A detailed macro shot shows a digital bar chart with an arrow trending upwards, indicating positive growth and financial success
Close up of a stack of cash being flipped very fast
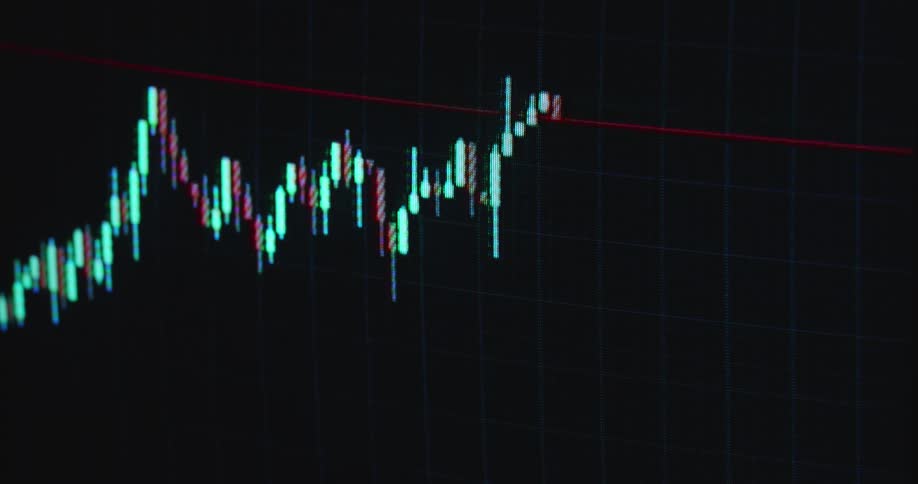
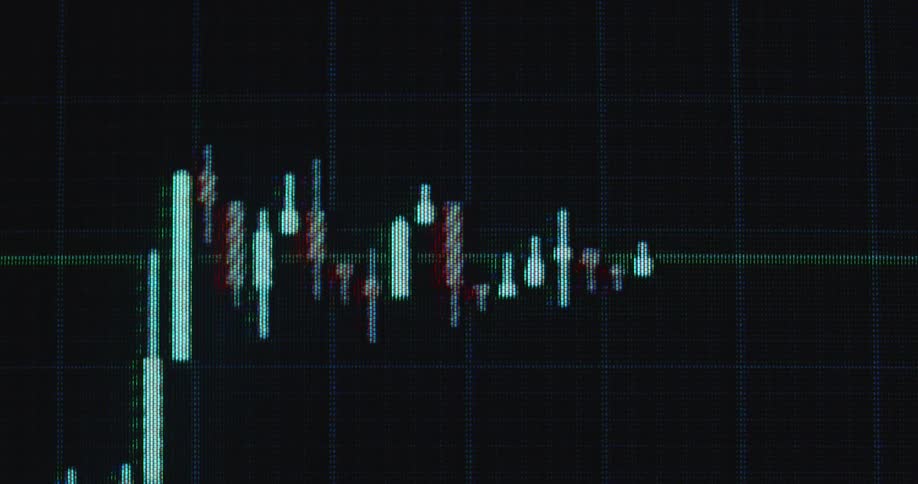
Close up of a candle diagram stock chart pattern on a digital RGB TV screen consisting of pixels and green and red candles as the graph rises with a positive upward tendency symbolising financial success and share trading
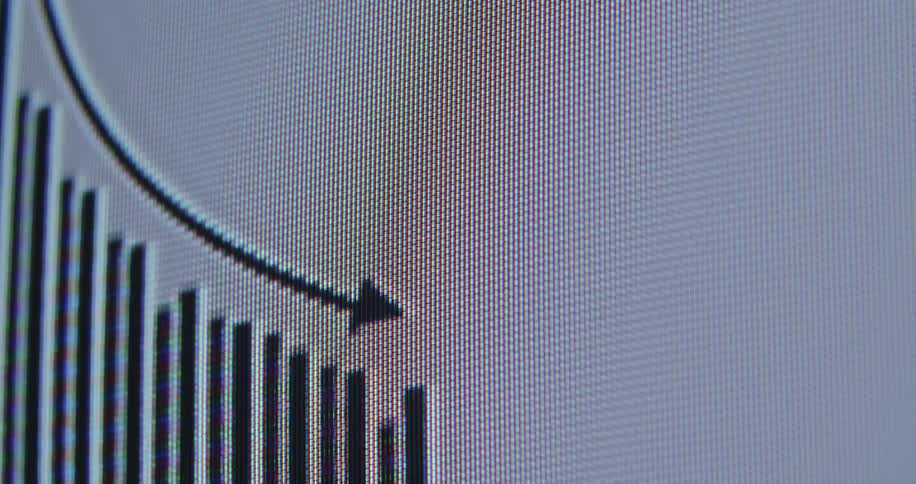
A macro view of a digital screen shows a black animated graph with a falling line chart and a downward pointing arrow overlaying vertical bar charts representing a market decline or financial loss on a white background
Financial charts with colored bars and lines displayed on a digital screen
Thousands of dollars are stacked on a table
The primary visual is a dynamic jagged trend line that changes color and style throughout the clips in the initial shots it appears as a sharp white line tracing rapid price fluctuations later it shifts to a vibrant green glowing line that follows
A close-up macro shot of a digital counter on a screen rapidly increasing to over two million dollars
The animated trading graph or candlestick chart is moving on the computer display as a recession hits the global finance markets and the prices crash as red candles symbolize the end of a market cycle and the beginning of a financial crisis or depression
Banknotes stacked in a machine
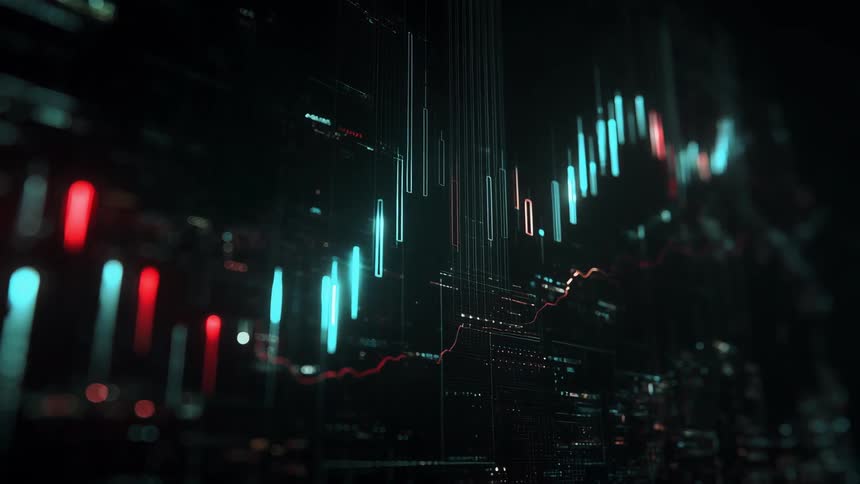
A detailed, close-up view of a live financial candlestick chart showing market volatility with moving green and red bars
Small lines form image on american paper money
An animated circular Bitcoin cryptocurrency logo is displayed upon a pixelated computer screen representing crypto mining on the blockchain and the future of the global banking and financial system
Retro Macintosh computer screen displaying financial market chart of an online trading platform or broker application for buying stocks or shares with bright neon green candles as the price goes up or increases with a positive trend
Bullish financial market candle chart
Red and green candlestick chart on a pixelated screen with RGB pixels as the bearish graph breaks resistance to the downside and the market or asset value collapses causing massive losses and volatility due to an unexpected crash
Candlestick chart against a gray background
A view of paper money
Close up of the portrait on an united states dollar bill
A flame burns in front of cash
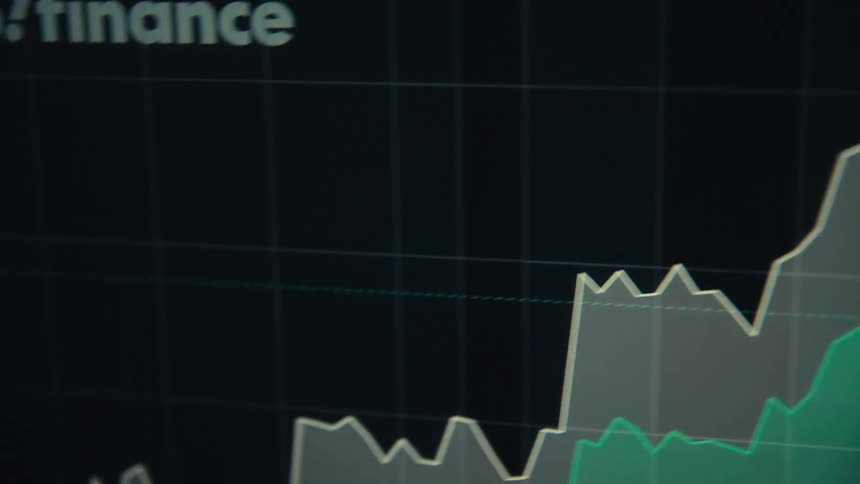
Glowing green and red digital line graphs display financial data on a dark background
A spotlit silver briefcase filled with stacks of cash rotates against a black background
A macro view of a digital screen displays a falling stock market chart with a downward trend arrow
Handheld macro close-up of bullish financial market chart or candlestick trading graph on black screen displaying the UI of stock or crypto broker application or platform as the price surges and the value of the asset increases during investment bull run
Macro shot of a financial chart on a computer screen indicating a downward trend with a black arrow
Coins falling is displayed
The original Bitcoin or BTC logo created by crypto currency developer Satoshi Nakamoto animated on a computer screen composed of illuminated digital zeros and ones is displayed in front of dark background
A digital percentage counter rapidly increases from one to ninety-nine percent before a blue checkmark confirms completion
A digital investment graph trend line shifting between going up and down as a stock trading market prognosis or index of the finance sector affected by the global economy in the darkness on black flickering retro computer screen
The value designation number on a banknote
A person scrolls through financial information on a cell phone
Numbers and a line chart are on the computer monitor
United states paper money bill
A mesmerizing first-person journey through the illuminated streets and highways of a modern city at night
A screen with red and blue graphs
A colorful, stylized animation of a financial candlestick chart displays market volatility on a digital grid
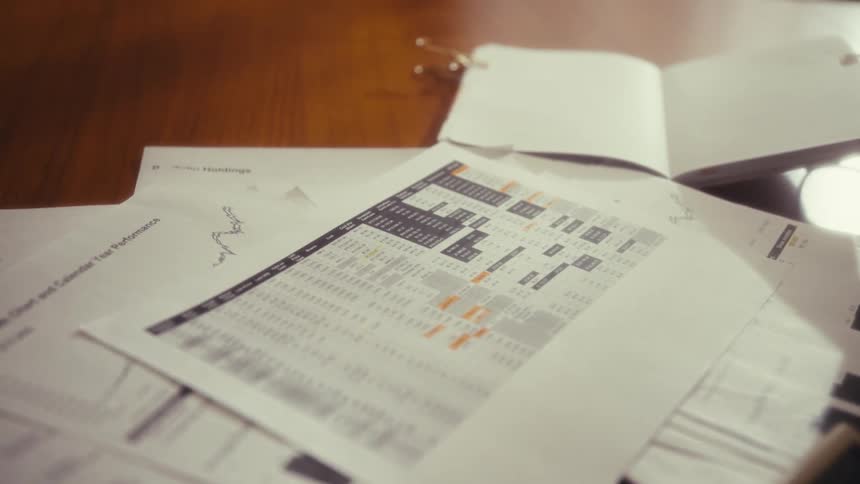
A woman is in an office at a desk using a calculate as she looks at graphs on papers
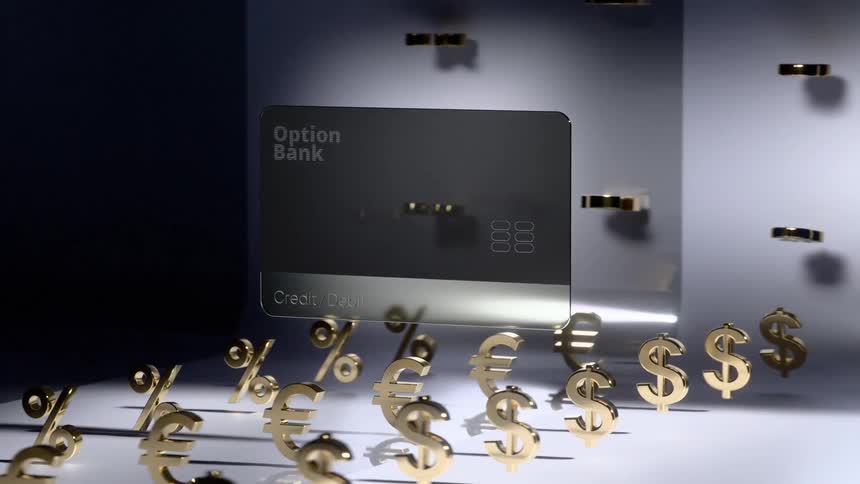
Currency symbols dance around a credit card
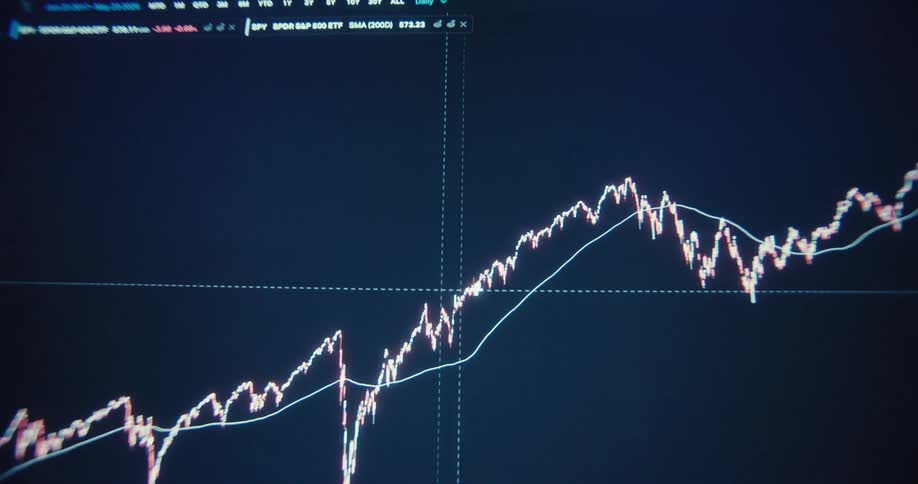
Closeup of a computer screen displaying realtime stock market charts and financial data
A close up shot of a dark digital screen displays a list of cryptocurrency data and financial charts with shifting green and red lines
Gold plated bitcoin coins with logo shimmering in the light
Calculator on top of books in a carpet store
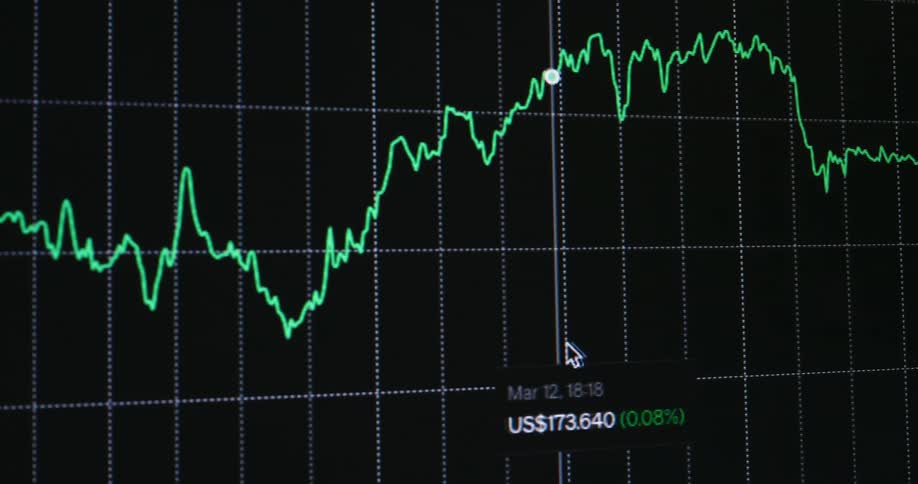
Cursor causing the screen to scroll to the right as it moves along the graph line
Pixelated candlestick chart on a screen or monitor panel forming a bullish flag pattern while the trading chart analysis shows that the graph is about to break resistance to the upside making the price of the stock or asset go up and increase in value
Bullish and bearish financial market candle chart
Soft focus close up of a digital stock market candlestick chart displaying volatile price movements
A woman is sitting at a desk with a laptop and using a calculator
Overlapping line and candlestick charts display intense financial fluctuations
A financial trading graph with colorful lines displaying market trends
English paper currency lies close on surface
American banknotes fall onto a dark surface one by one
Close up of man trading on a laptop and desktop computer in a room
Red candlestick charts indicate sharp market downturn with fast price movement and negative development caused by stock or finance market crash and recession displayed on digital computer screen causing stress and panic while assets lose value

Need help finding the
right footage?

Have it delivered to your account within 1 business day.

This is Filmsupply

Our StoryOur FilmmakersArticlesFilmsPopular SearchesAll Categories

FM

A family of brands dedicated to empowering the creative.

FILMSUPPLY

Footage licensing for productions

MUSICBED

Music licensing for filmmakers

STILLS

Image licensing for creatives

© 2026 FM LLC.

Privacy PolicyLicense TermsTerms & ConditionsCareers