Musicbed
Filmsupply
Stills
Contact Us(800) 805-6802
Digitized grids and numbers move across the screen
Red falling trading chart of an online stock broker or crypto exchange in a downward trend during a bear market crash and financial crisis symbolizing failure bankruptcy insolvency and losses caused by declining international and global economy
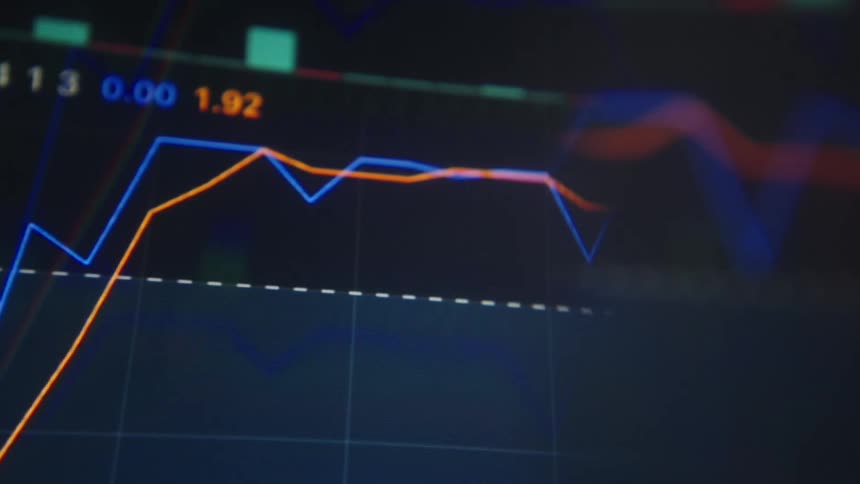
Blue and orange financial chart lines displayed on a digital screen
A pixelated smartphone or display device screen or monitor shows the user interface of a finance app or online broker and trading platform for buying and selling stocks and crypto currencies such as Bitcoin or ETH as the trading chart moves up
A blurry, close-up view of a digital stock market chart with fluctuating line and candlestick graphs on a screen
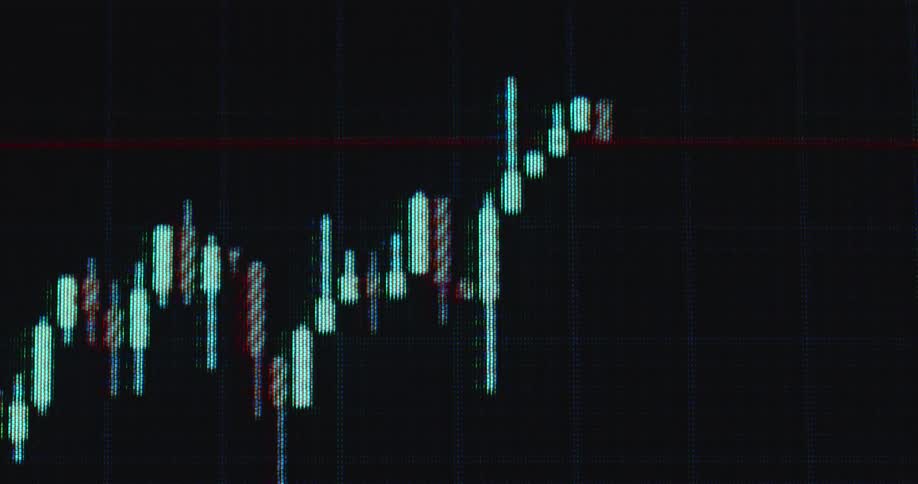
The candlestick trading chart or graph steadily rises with a positive upward tendency and trend showing the price development of the MSCI World or S&P 500 or another ETF as a store of value and protection against inflation
The animated trading graph or candlestick chart is moving on the computer display as a recession hits the global finance markets and the prices crash as red candles symbolize the end of a market cycle and the beginning of a financial crisis or depression
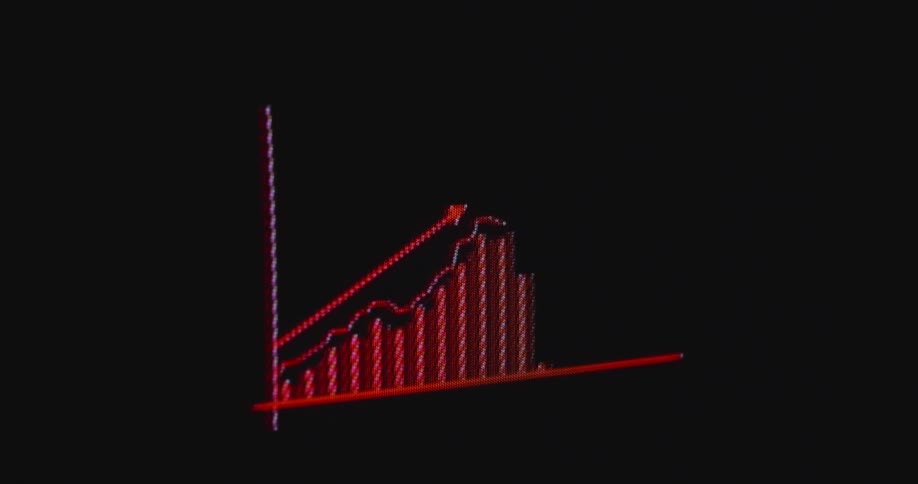
Wide angle shot of a pc screen that displays a red chart with an arrow rising from left to right while prices increase and the inflation rate keeps going up while the economy is fearing a recession as the fiat money system collapses
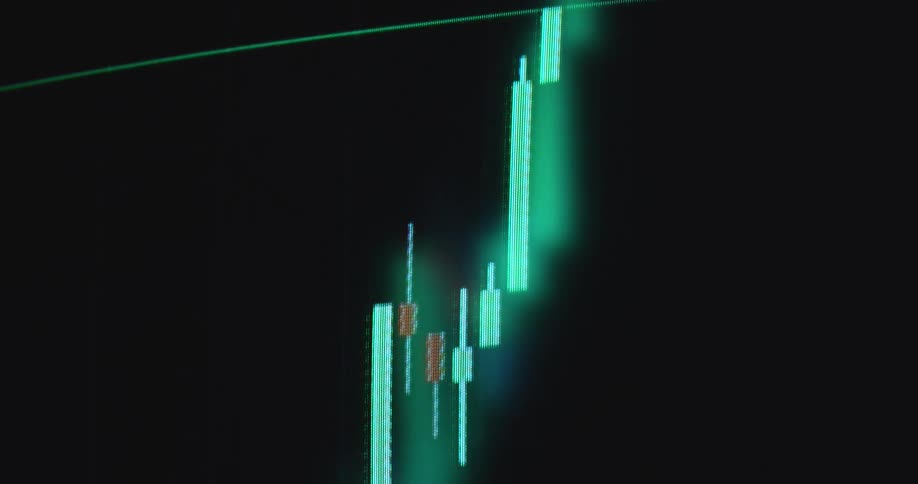
Retro Macintosh computer screen displaying financial market chart of an online trading platform or broker application for buying stocks or shares with bright neon green candles as the price goes up or increases with a positive trend
American banknotes fall onto a surface one by one
Gold bitcoin standing on a mound of black particles
The number on a banknote lying atop a pile of money
A retro animated bar graph on a vintage computer screen shows an upward trend of growth and success
A neon green retro monitor displays a chart showing the movement of a stock price with an arrow crashing with a dramatic downward or negative tendency or direction causing investors to lose money presented by data visualization
A closeup view of a stock market ticker displaying various stock symbols prices and percentage changes
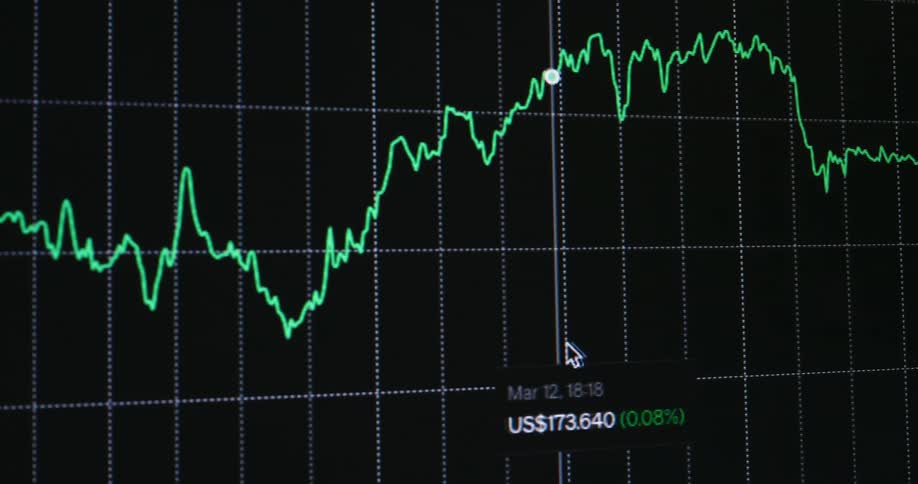
Cursor causing the screen to scroll to the right as it moves along the graph line
Small lines form image on american paper money
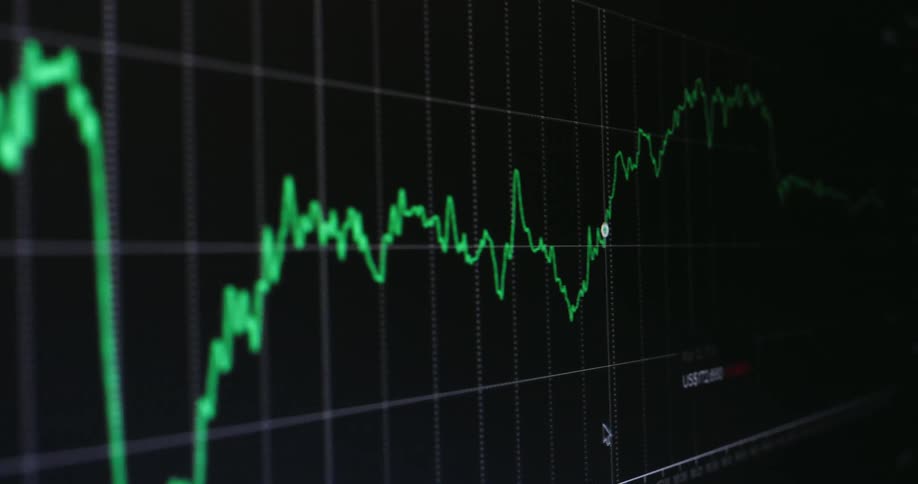
A line on a graph moves up and down as it travels across a screen
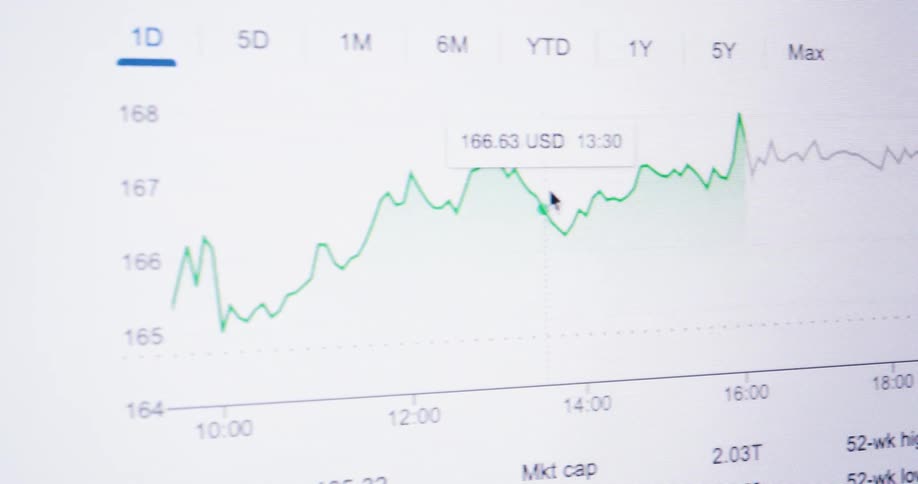
A closeup digital screen displays a fluctuating stock or financial chart
An out-of-focus close-up of a digital screen displaying a budgeting application tracking monthly spending on housing, food, and transport
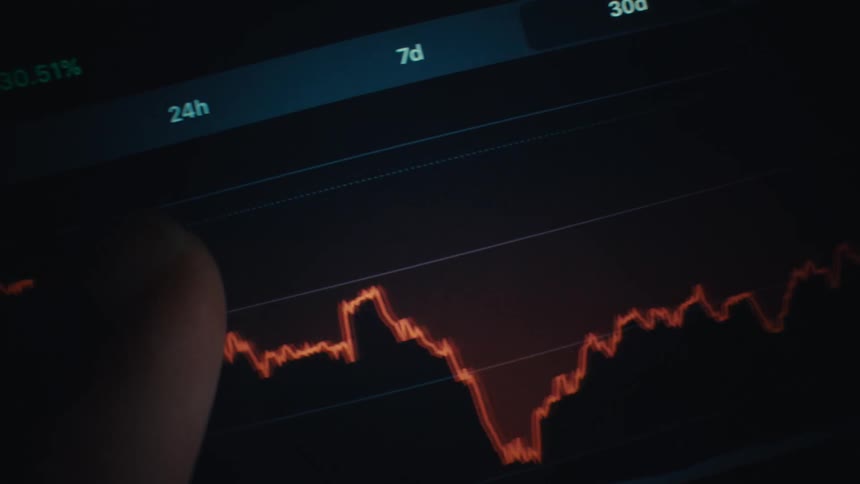
A finger scrolls a glowing market chart on a screen that shows fluctuating prices with sharp dips and recoveries
Looking up onto retro computer screen or monitor displaying a trading chart candlestick animation consisting of long green candles as the price increases and the broker or trader makes a successful trade with lots of profit and the stock reaches new ATH
Macro shot of a financial chart on a computer screen indicating a downward trend with a black arrow
A closeup of a persons hand shows their thumb touching a smartphone screen displaying a financial line graph for the stock market
Financial chart bars in green and red tones with blur
A closeup of layered line and area graphs in teal pink and gray against a dark grid the sharp peaks and troughs and overlaid legend suggesting volatile financial or technical data
Graph on smartphone displays data for series of points on the plot
A close-up of a business analytics chart loading on a digital screen, focusing on 'Services' and 'Subscriptions'
A close-up of a digital screen shows a stock price crashing as the numbers rapidly decrease, ending with the market closing
A macro shot of a volatile stock price rapidly increasing on a digital trading screen, showing a significant percentage gain
Handheld macro close-up of bullish financial market chart or candlestick trading graph on black screen displaying the UI of stock or crypto broker application or platform as the price surges and the value of the asset increases during investment bull run
Closeup of a screen displaying distorted stock market data
Stock related data is scrolled over on a screen
A dense slightly blurred market leaderboard of tickers and redgreen figures fills the screen
A persons hands highlight a chart on a document and then press buttons on a calculator sitting on a table next to the papers
A close up shot of a dark digital screen displays a list of cryptocurrency data and financial charts with shifting green and red lines
The bar graph goes up and down across the entire computer screen
Graph of the price of a currency
A person is checking a graph on their phone
A computer screen displaying a stock market candlestick chart with fluctuating red and green lines indicating market trends
Mouse scrolling over a graph of the value of a currency
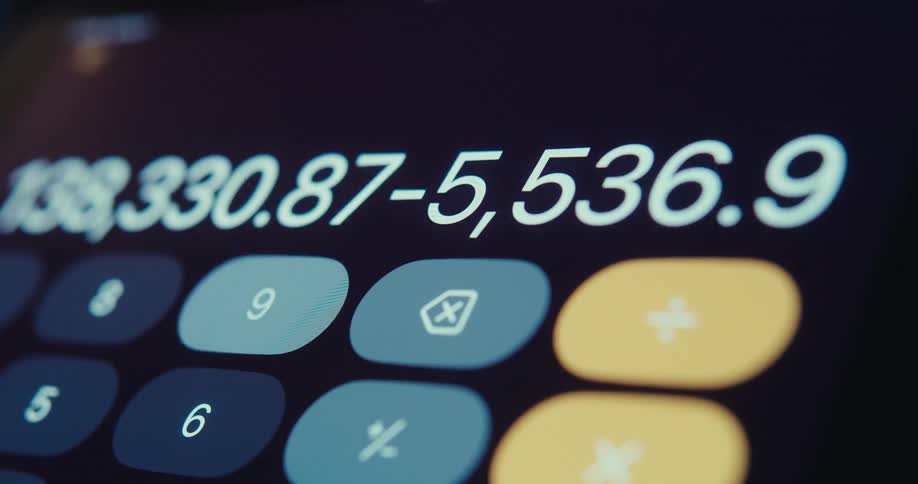
Close up of a device screen displaying a calculator application interface performing subtractions
Digital table with market numbers and percentages in green and red
Shaky handheld extreme macro shot of black numbers or digits counted in percent or percentage goes up and down while rising and falling and changing color to white symbolizing downloading uploading or scanning process
A screen with red and blue graphs
Extreme macro close-up of a computer monitor showing a bar graph with a downward arrow indicating a financial market crash, economic recession, or loss
A pile of british banknotes lying on a surface
A close-up shot shows a digital investment portfolio's total balance rapidly fluctuating on a dark screen
A clip of a screen displaying a digital trading candlesticks
Artwork on american bank notes
A blurry stock line graph slopes downward against a blue background
Currency bills decorated with geometric designs and artistic images lie scattered
Finger pointing at a market line chart displayed on a digital screen
A line graph is on the computer monitor
Fifty dollar bills are together
A close up clip of a trading chart
Static shot of a falling graph from an online trading application in a down trend during critical market cycle entering bear market after a crash and crisis on vintage screen with rgb pixels and glitches and retro digital look
United states bank notes piled on a flat surface
A computer monitor displays a stock market candlestick price chart
A view of paper money
Graph of the value of a currency
A wall of graphs reflected on the floor
A messy pile of british banknotes

Need help finding the
right footage?

Have it delivered to your account within 1 business day.

This is Filmsupply

Our StoryOur FilmmakersArticlesFilmsPopular SearchesAll Categories

FM

A family of brands dedicated to empowering the creative.

FILMSUPPLY

Footage licensing for productions

MUSICBED

Music licensing for filmmakers

STILLS

Image licensing for creatives

© 2026 FM LLC.

Privacy PolicyLicense TermsTerms & ConditionsCareers