Musicbed
Filmsupply
Stills
Contact Us(800) 805-6802
Building on a dollar bill
Multiple rows of graphs and numbers quickly scroll by on a screen
Extreme close-up of a digital stock market display showing volatile price fluctuations in real-time
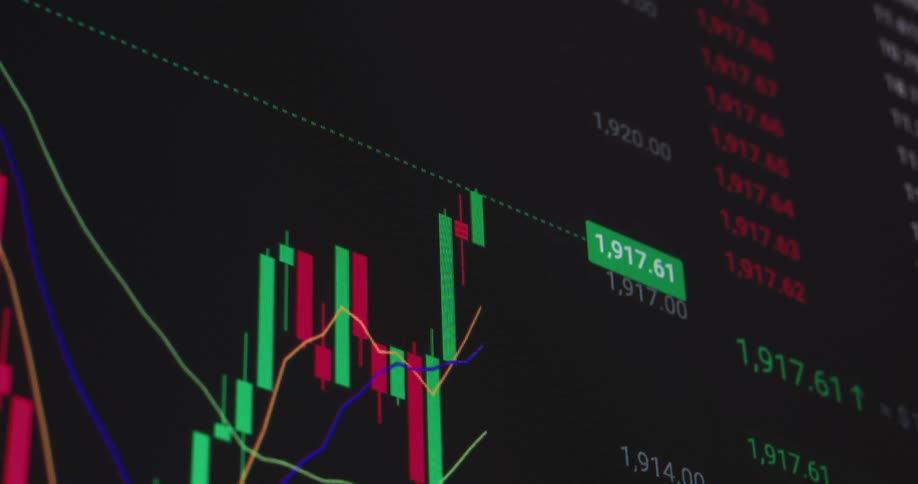
A computer monitor displays a candlestick chart of a stock price with the graph actively scrolling to the right
Artwork on american bank notes
Birds fly over the crane at sunrise
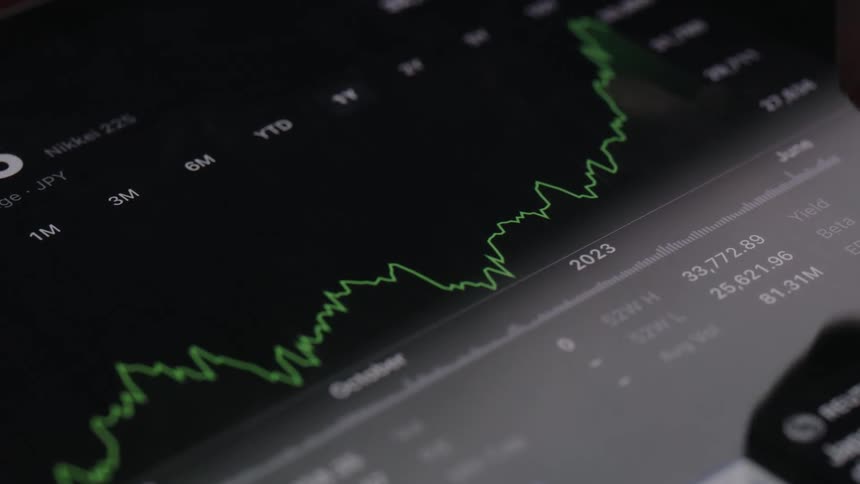
A digital graph on a screen shows a volatile stock price or cryptocurrency value fluctuating up and down, indicating gains and losses
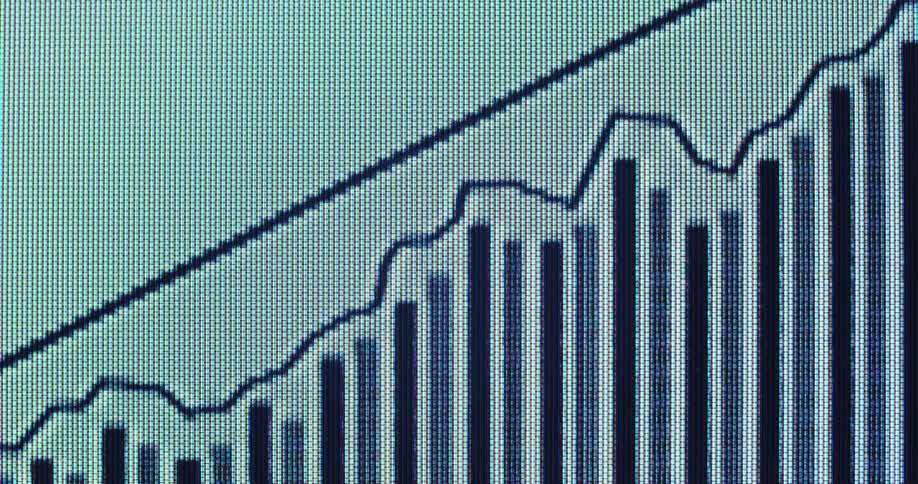
Pixelated bar animation or sales chart with an upward line represents continuous growth over time as the value increases during financial data presentation due to positive development or great business performance with economic success
A blurry, abstract animation of a candlestick chart showing stock market or cryptocurrency volatility on a digital screen
A screen shows a financial chart with lines and bars moving up and down
Numbers grow on the graph displayed
The neon green graph forms an old 90s computer screen showing a vintage user interface of a stock trading platform or exchange as the commodity and equity prices crash and a global recession hits the finance markets
An out-of-focus close-up of a live stock market or cryptocurrency candlestick chart showing real-time price fluctuations
Colorful candlestick chart against a background
A dollar bill sits on a stack of other bills
A financial trading graph with colorful lines displaying market trends
The financial markets get hit by a black swan event causing a massive crash or recession leading to a global economic crisis and great depression symbolized by a trading chart or graph that sharply falls into the red digits with dramatic downward movement
Dramatic macro shot of pixelated computer monitor showing a trading chart or financial graph crashing as the global economy is hit by a recession causing great depression and panic sales at the financial markets
A blurry, abstract close-up of a green stock market chart on a digital screen, with graphs and data showing upward trends and growth
Closeup of a computer screen displaying realtime stock market charts and financial data
Graph of the value of a currency
Futuristic macro close up of a retro digital CTR screen playing animated graph with a rising line chart and upward pointing arrow overlaying moving black bars representing stock market or business growth with financial success on white background
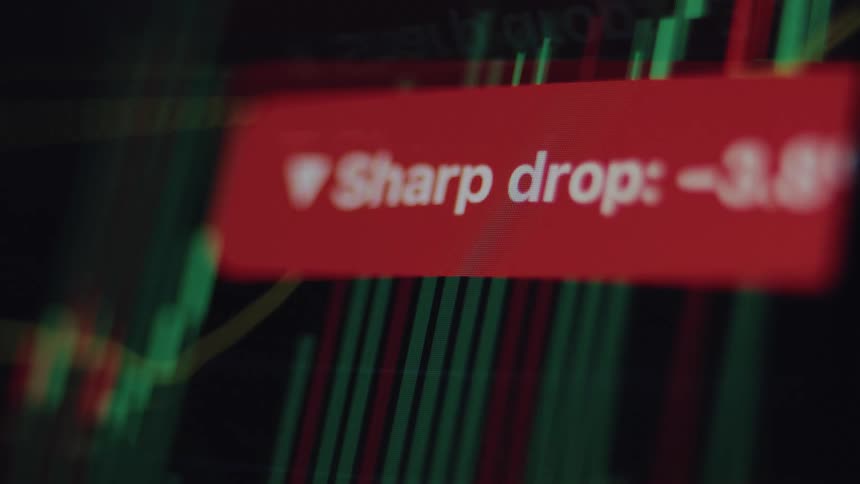
A close-up of a digital stock market chart on a screen shows a red notification alerting to a sharp drop in value
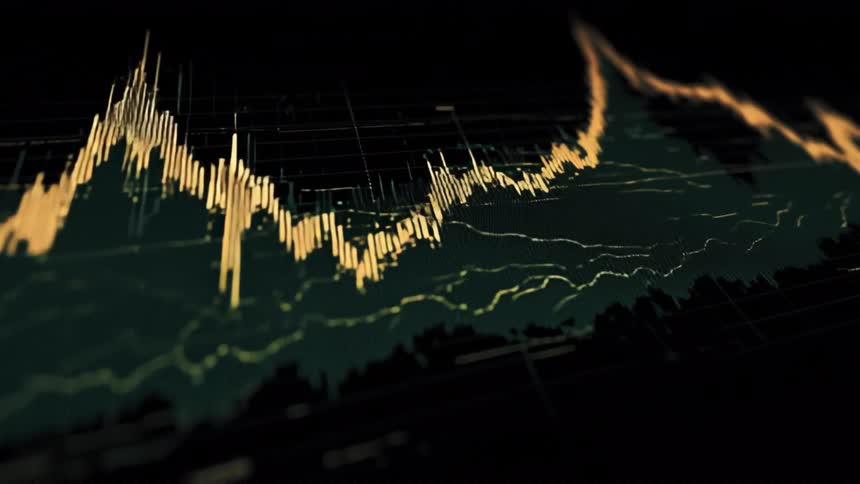
An angled closeup shot captures the dramatic peaks and valleys of a digital financial analytics chart with glowing yellow and green lines
Close up of the shiny engraved surface of golden bitcoin physical coins over a reflecting surface
Close up view of a person looking at their phone
A closeup digital screen displays a fluctuating stock or financial chart
Negative statistical data presented on a pixelated display device as the bars and arrow trend line follow a declining price development symbolizing a failure of the financial system and recession of the global economy
A colorful, stylized animation of a financial candlestick chart displays market volatility on a digital grid
A financial chart shows a volatile market trend with sharp rises and dips over time
An american one hundred dollar bill
A monitor displays a stock market candlestick chart with green and red candles moving across a dark grid
A macro shot of a financial chart on a screen displaying a red 'Sharp drop' notification indicating a market crash
Computer monitors are showing graphs and data
Extreme close up of the text on the surface of an united states of america dollar bank note
A graph of fluctuating stock data displays on a dark digital screen
A red and green line graph depicting a sharp decline is prominently displayed on a dark background suggesting a financial downturn and loss
CRT or cathode ray tube monitor with RGB pixels displaying animated bar chart with negative trend line and downward pointing arrow going down as the business expenses are lowered or the profit is declining due to bad economic development
Stylized, soft-focus animation of a stock market or cryptocurrency trading chart with fluctuating data and glowing lines
Multiple lines and a candlestick chart occupy the same graph on a digital screen as a selection is made
Charts of currencies rising and falling
A vibrant green digital graph displays fluctuating diagram consisting of lines and vertical bars with a prominent downward arrow indicating a decline of the Wall Street stock market or global economy with negative price development
A blurry close-up of a digital financial graph shows a downward trend indicating a market crash or economic recession
Financial market candlestick chart displayed against a blurred background of buildings
A closeup shot of a screen displaying fluctuating stock market graphs and numerical data
A candle diagram graph plots an array of data on a pixel screen with numbers representing rising and falling real estate prices or changes in the stock market or crypto currency finance sector
A close-up of a red, pixelated bar chart with an upward trending arrow animates on a black digital screen, indicating positive growth
An animated red bar graph with a downward pointing arrow trends down, symbolizing economic recession
A blurry close-up of a digital stock market ticker shows financial data changing rapidly on a blue screen
Finger pointing at a market line chart displayed on a digital screen
Graph of the price of a currency
A macro view of a digital screen shows a black animated graph with a falling line chart and a downward pointing arrow overlaying vertical bar charts representing a market decline or financial loss on a white background
Green numbers fluctuate rapidly on a dark stock market ticker screen, displaying real-time financial trading data
Close up of device screen displaying a trading interface with candlesticks and indicators over a dark background
A single shiny coin with the bitcoin logo on it stands atop a wet surface
Person touching a screen of an electronic device
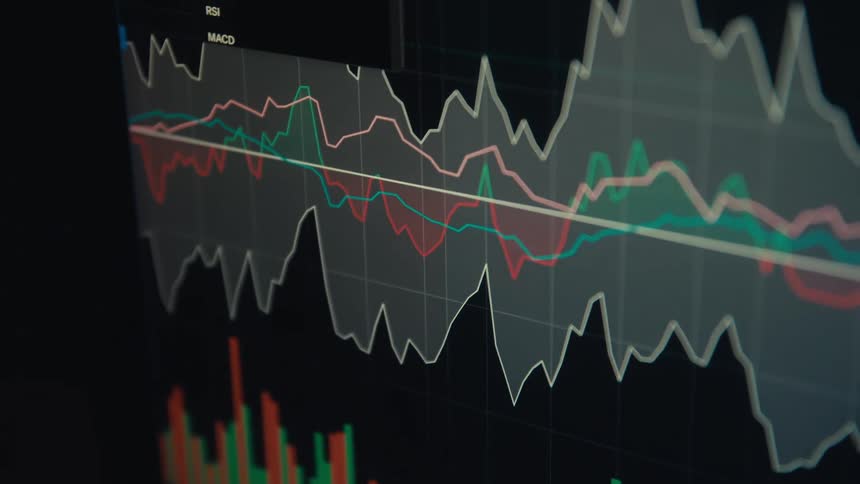
Market chart displaying shaded areas and colored lines representing financial fluctuations
Extreme close-up of a declining financial chart on a digital screen with a downward-pointing arrow indicating a market recession
A close-up of a computer screen displaying a real-time candlestick chart for online stock, crypto, and forex trading
Price variation chart with green and red lines showing financial values
A candlestick chart showing a stock price rising with green candles indicating upward movement while the Dow Jones or MSCI World ETF increases in value and price symbolizing a strong US economy and healthy global financial markets
Green and orange colors of a candlestick chart contrast with the black background on a computer display
A close-up of a digital candlestick chart on a screen shows financial data fluctuating in real-time

Need help finding the
right footage?

Have it delivered to your account within 1 business day.

This is Filmsupply

Our StoryOur FilmmakersArticlesFilmsPopular SearchesAll Categories

FM

A family of brands dedicated to empowering the creative.

FILMSUPPLY

Footage licensing for productions

MUSICBED

Music licensing for filmmakers

STILLS

Image licensing for creatives

© 2026 FM LLC.

Privacy PolicyLicense TermsTerms & ConditionsCareers