Musicbed
Filmsupply
Stills
Contact Us(800) 805-6802
Close-up of a business intelligence dashboard on a computer screen showing animated graphs and charts in dark mode
A close-up shot of the word 'Services' coming into focus on a dark digital user interface screen
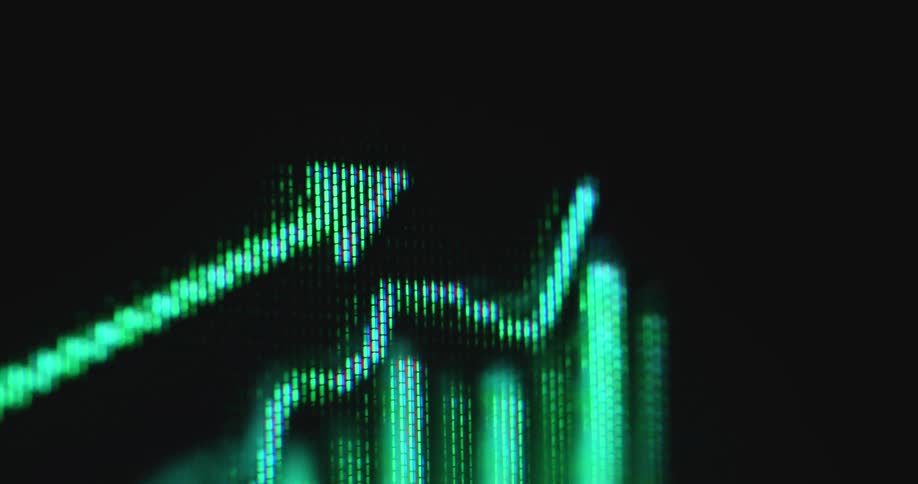
Pixelated screen of a vintage 90s computer displaying a green graph with an arrow pointing upwards symbolizing the beginning of the digital financial era and the first online trading platforms for buying stocks in the internet
Line graphs and information are displayed on the computer screens
A line graph is displayed on a monitor on the side of a building
Dramatic wide upward view of a pixelated tube TV screen displaying or showing a digital equalizer with numerous glowing white vertical bars fluctuating across a black background while visualizing the sound of loud pop music
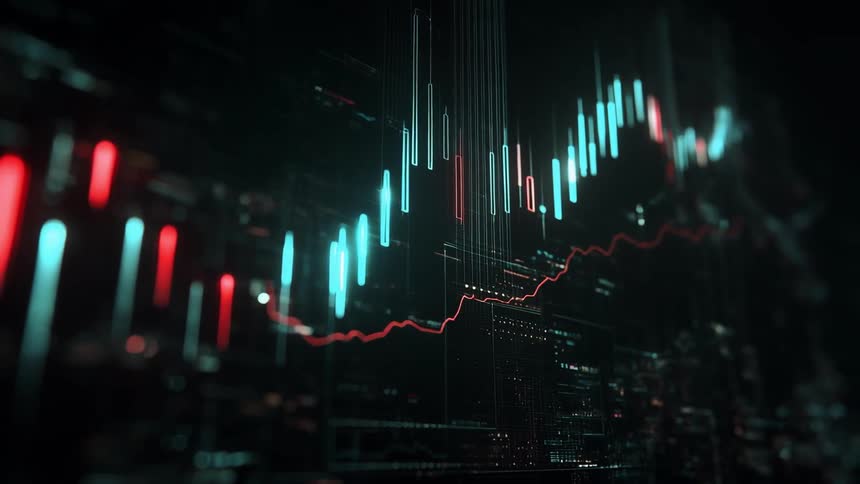
Bullish financial market candle chart
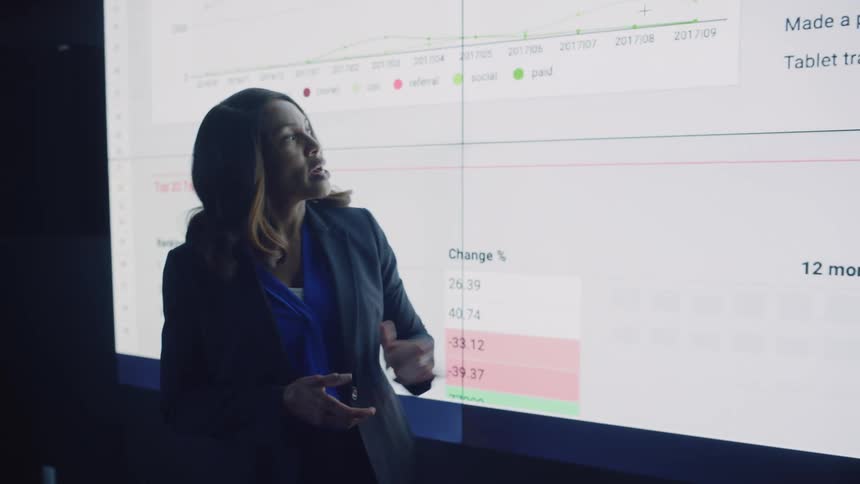
Woman in an auditorium presenting a graph on a digital screen
A close-up of a social media live view counter rapidly climbing into the millions, showing the video going viral
A closeup rapid scroll through various tiktokrelated applications in an app store on a tablet screen highlights analytics and content management
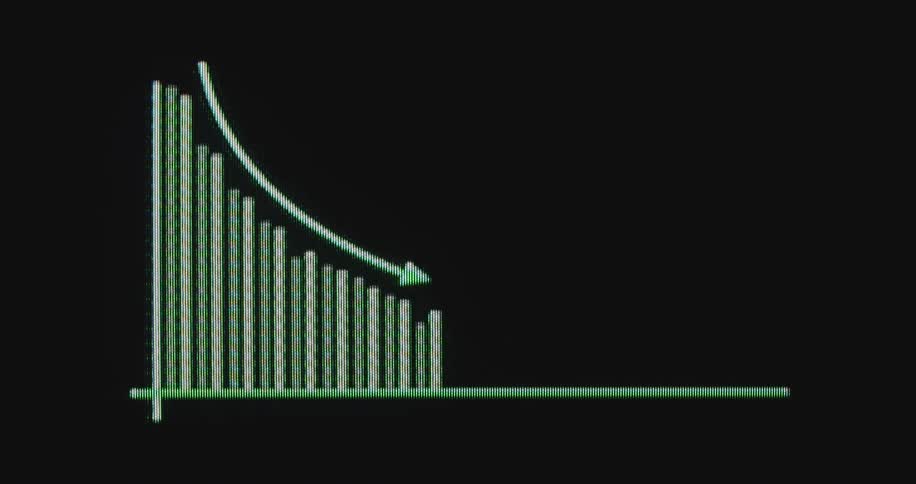
Extreme macro view of a digital screen with RGB pixels shows a black line graph with a downward pointing arrow overlaying vertical black bar charts representing a stock market crash or economic downturn with negative trend
Unrecognisable coding or programming text in an encrypted computer language such as HTML or Javascript is automatically appearing on a pixelated 90s computer terminal display device during system startup or booting process
Graph and numbers moving on the screen of a smart phone
An animated bar graph with a red arrow illustrates a declining trend, symbolizing financial loss or economic downturn
A wall made up of animated graphs
An analyst uses a stylus to review data on a laptop, with charts and graphs visible on a second monitor in the background
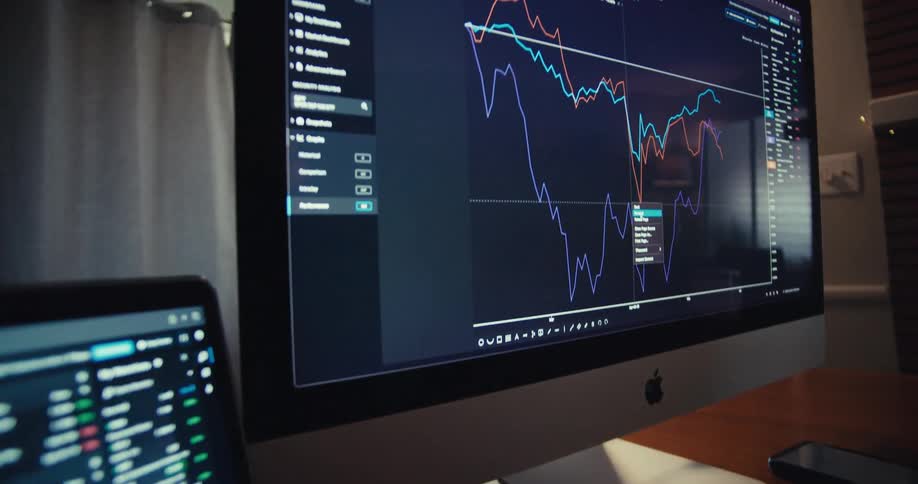
Closeup of a computer screen displaying realtime stock market charts and financial data
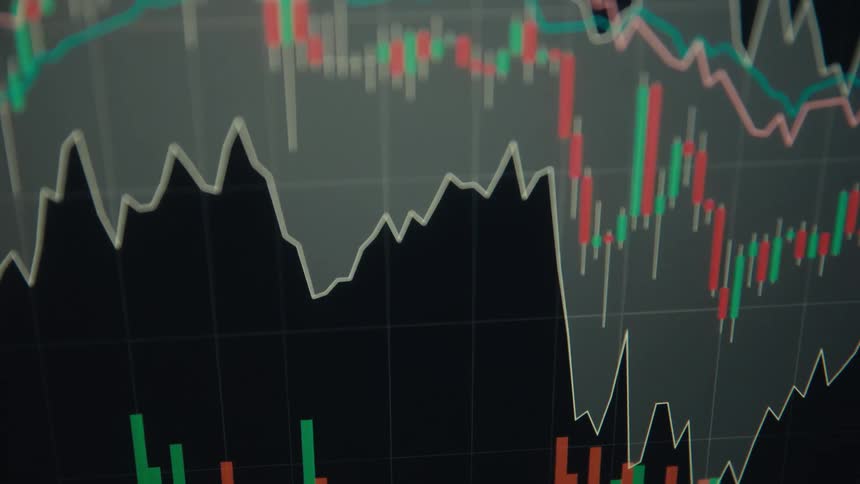
Financial market candlestick chart against a dark background
The corner of the amazon webpage
A black screen displays rows of monetary values in different categories in white text
Digitized trading graph crashes and falls down as the stock market collapses with a negative downward tendency into the red digits providing opportunities for new stock brokers and investment strategies in the equities or crypto currency market
Pixelated bar animation or sales chart with an upward line represents continuous growth over time as the value increases during financial data presentation due to positive development or great business performance with economic success
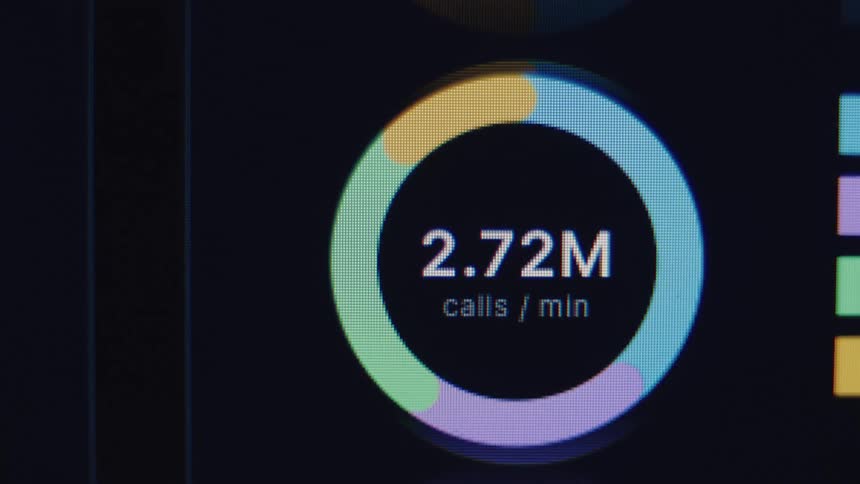
A macro shot shows a digital dashboard displaying real-time analytics of calls per minute, with the numbers constantly updating
Black background with abstract blue lines patterns
Negative statistical data presented on a pixelated display device as the bars and arrow trend line follow a declining price development symbolizing a failure of the financial system and recession of the global economy
Close-up shot of a woman's hand using a pen to point at financial charts and data analytics on a laptop screen during a business presentation
Hyperparameter tuning setup with gridsearchcv to optimize a random forest model
A display screen shows charts in gold color
Close up of pixelated investment graph going up during an upward trend as a symbol for rising stock market and financial freedom and success during economic growth on an old TV or computer screen showing a finance app
Candlestick and line charts display variations on a financial panel
Extreme macro closeup of abstract multicolor rainbow neon lights being transformed and spinning in a circle with full cycles on a glitching digital pixelated display
Two female colleagues collaborate while analyzing data and graphs on a computer in their cozy home office
A close-up view of a computer screen displaying a modern user interface, with the focus on the 'Onboarding' menu item
An animated retro-style green bar chart with digital distortion shows a steep decline on a dark screen
Financial candlestick chart against a gray screen
Symmetrical audio or music sound equalizer animation or motion graphic being displayed on a screen with black background and visible RGB pixels symbolising the sense of hearing or sound perception in the digital age
Financial market chart in patterns against a dark background
A close up view of financial data charts and graphs displayed on a screen with light distortions
Red candlestick charts indicate sharp market downturn with fast price movement and negative development caused by stock or finance market crash and recession displayed on digital computer screen causing stress and panic while assets lose value
Closeup shot of multiple screens displaying realtime stock market data and charts
Two diverse women collaborate on a project, pointing at graphs and data on a computer screen in a cozy, modern office
A screen shows a financial chart with lines and bars moving up and down
A macro close-up of a computer screen displays business metrics showing 'Steady growth' for monthly active users
Macro shot of a computer screen showing a red bar chart and arrow indicating a positive, upward trend in financial data
Dynamic macro close up of a RGB pixel device screen displaying multiple rotating overlapped hourglass timer icons while the sandglass symbol visualizes the concept of time in a black abstract and digital space
The green pixels of a retro display device show the tips of sound bars from a 2D equalizer motion graphic animation as the sound waves move up and down with the different frequencies
A finger scrolls a glowing market chart on a screen that shows fluctuating prices with sharp dips and recoveries
An angled closeup shot captures the dramatic peaks and valleys of a digital financial analytics chart with glowing yellow and green lines
Woman in a dark room presenting a slide on a large screen with graphs
A dark screen with some numbers and letters written in white text
Computer program creates a red line graph on a PC monitor going up and down and falling after being rejected by the trend line as a symbol for financial meltdown and losing money in the stock and crypto investment market
Graphs flash on the screen
A macro close-up of a blue digital stock market or cryptocurrency chart on a screen showing real-time price volatility and fluctuations
Abstract projection of blue lines on a dark background
A digital chart with a downward-pointing arrow slowly pans across a screen, symbolizing economic decline
Extreme macro close-up of a computer monitor showing a bar graph with a downward arrow indicating a financial market crash, economic recession, or loss
A scrolling closeup shot shows a screen displaying lines of python code primarily for machine learning tasks like fitting logisticregression and calculating accuracyscore the code features contrasting colors like yellow cyan and orange syntax hi
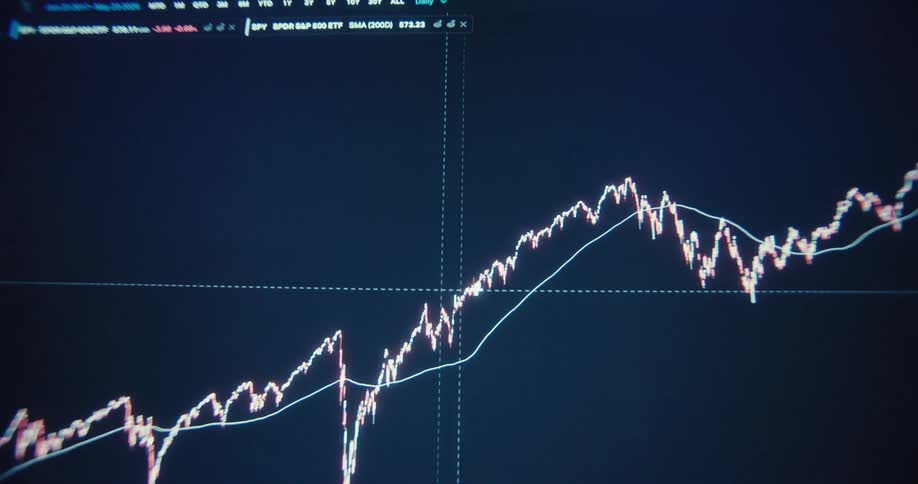
A computer monitor displays a stock market candlestick price chart
A close-up, angled view of a digital calendar reveals a busy schedule with various meetings and appointments
Multiple lines and a candlestick chart occupy the same graph on a digital screen as a selection is made
A symmetrical multi-colored rainbow circle spins on pixelated display in the colors of the flag of the LGBT and LGBTQ or LGBTQ+ movement as a symbol for queer power or pride and diversity
A digital counter on a screen rapidly increases the number of meetings, symbolizing a busy schedule
Macro shot of a digital percentage counter on a dark screen increasing with a progress bar

Need help finding the
right footage?

Have it delivered to your account within 1 business day.

This is Filmsupply

Our StoryOur FilmmakersArticlesFilmsPopular SearchesAll Categories

FM

A family of brands dedicated to empowering the creative.

FILMSUPPLY

Footage licensing for productions

MUSICBED

Music licensing for filmmakers

STILLS

Image licensing for creatives

© 2026 FM LLC.

Privacy PolicyLicense TermsTerms & ConditionsCareers