Musicbed
Filmsupply
Stills
Contact Us(800) 805-6802
Data Visualisation Stock Video Footage

Licenses 3272 high quality Data Visualisation stock video clips in 4K, raw formats

Binary Tech And Computers

Evolve

Abstract Projections In Studio

Hillsong Film

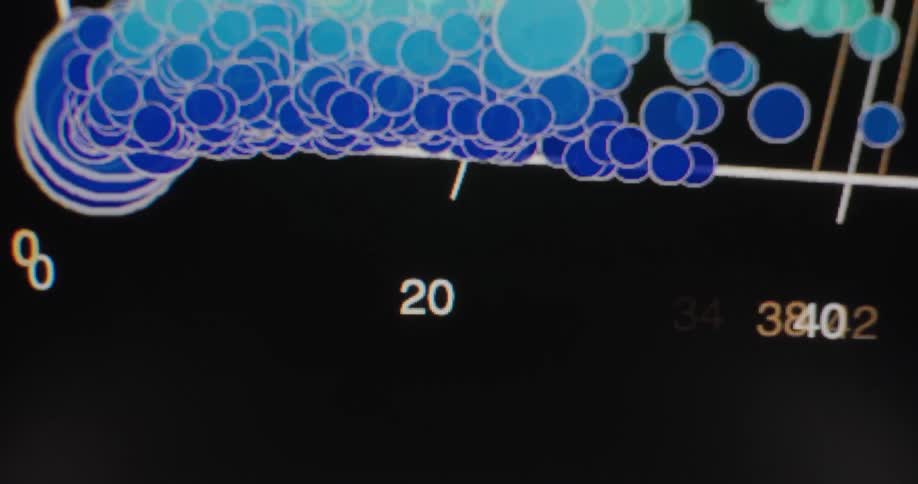
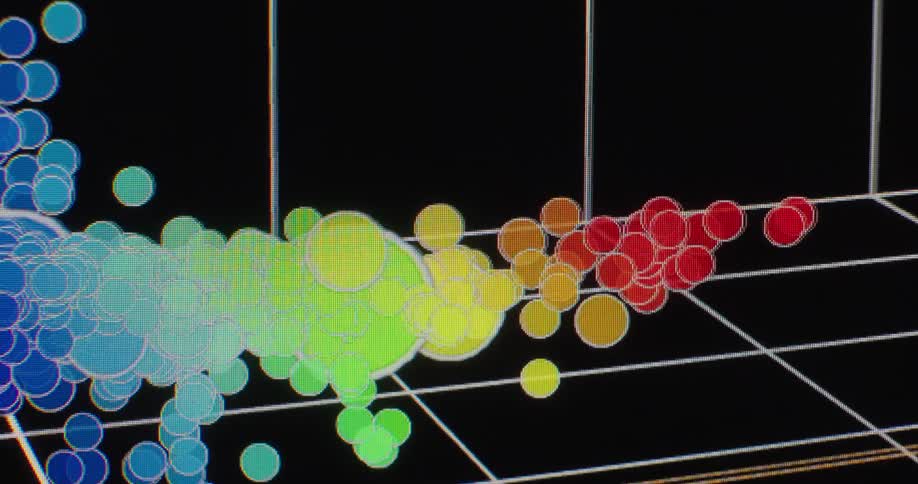
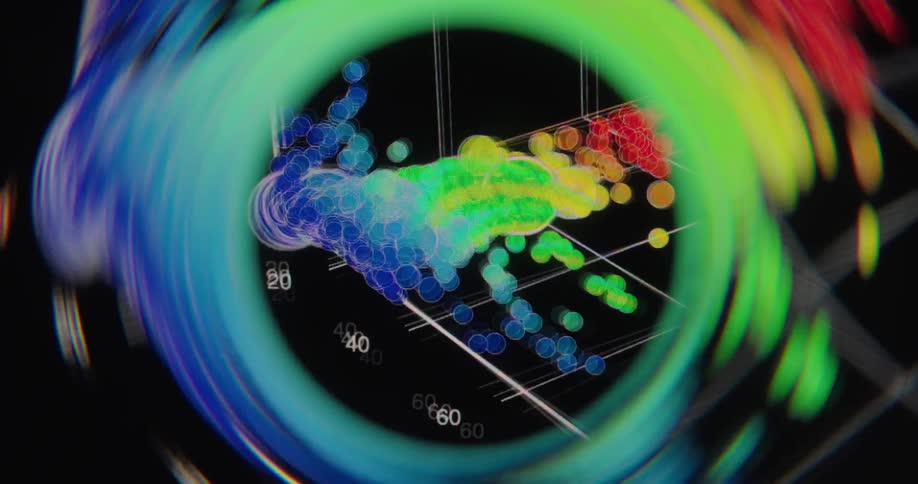
A dynamic data visualization of a 3D scatter plot with colorful dots representing protein analysis rotates within an abstract frame
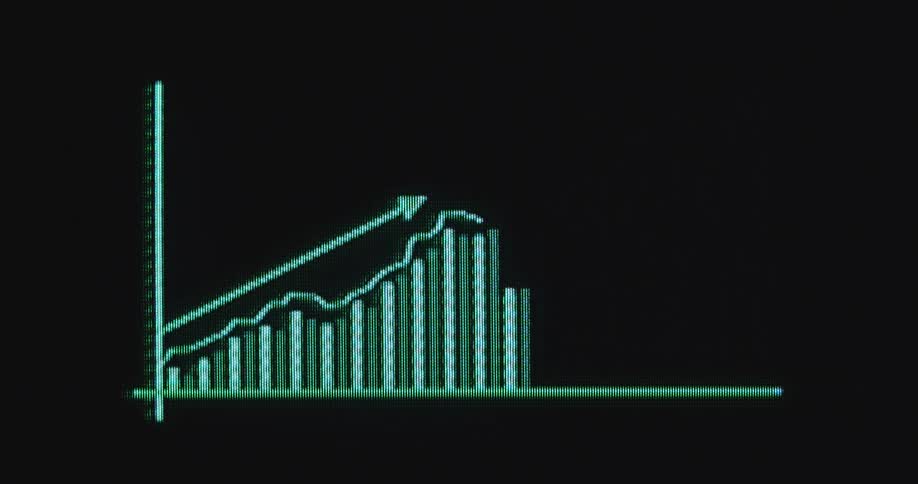
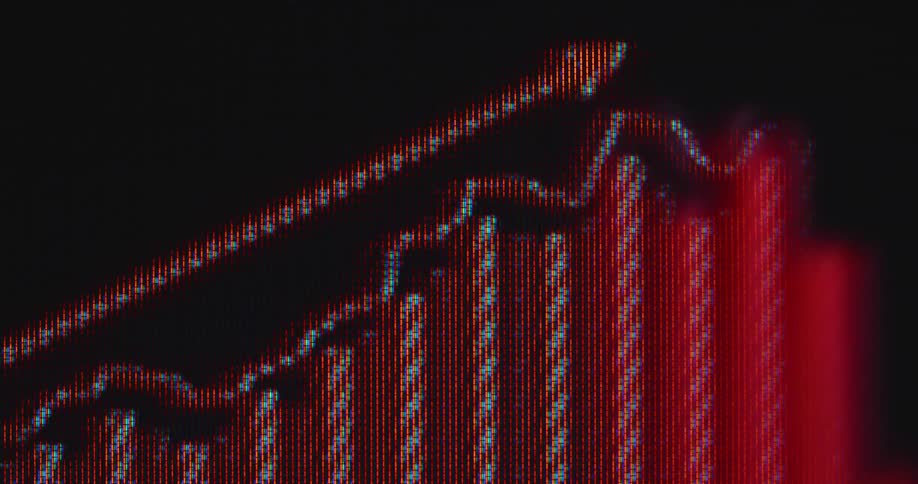
A bar and line graph shows an upward trend with an arrow emphasizing growth and increasing savings on the bank account for a solid retirement due to a successful pension plan and long-term investment strategy
Close up of a computer screen displaying a coding software interface
Bullish and bearish financial market candle chart
Digital artwork shows lighted dots against a black background that connect and turn into flashing lines
Multiple colorful lines move in an animated digital graph
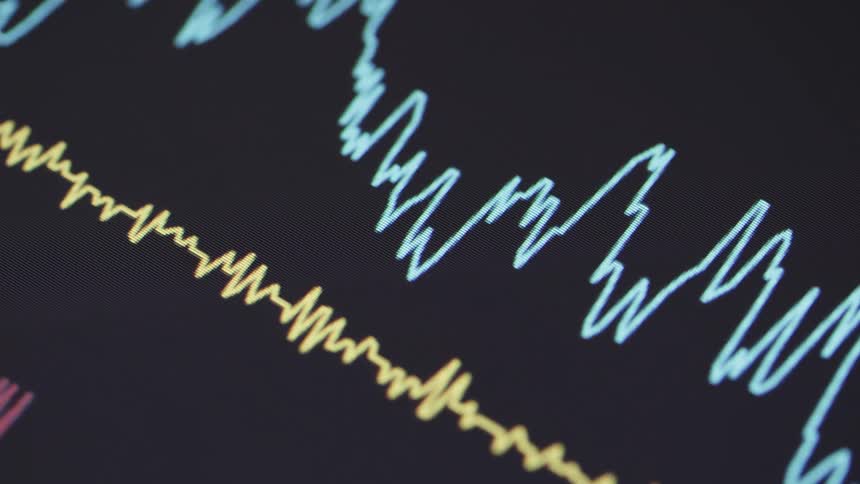
A closeup of a pixeled digital screen shows colorful animated data graphs and audio waveforms fluctuating against a dark background
Orbit Shot of a Blue AI Neural Network - Abstract Data Flow - Machine learning - Nodes and Lines
Digital animation of a brain
The monitor shows a map with arrows moving all over
Macro close up shot of a colorful data visualization graph displaying scientific analysis on a computer screen
An animated bar graph with a red arrow illustrates a declining trend, symbolizing financial loss or economic downturn
Close up of a line graph on a screen under a blue light while the camera comes on and off focus
Multicolored blob shrinks as it disperses small white spots
An abstract animation of a futuristic interface tracking and analyzing organic matter on a digital grid
Line graphs flash on a screen
Series of candlestick stock prices displayed on a screen
Dolly Out Shot of a Purple AI Neural Network - Abstract Data Flow - Machine learning - Nodes and Lines
A disorienting time-lapse from a moving vehicle captures abstract, colorful streaks of city lights painting the dark night highway
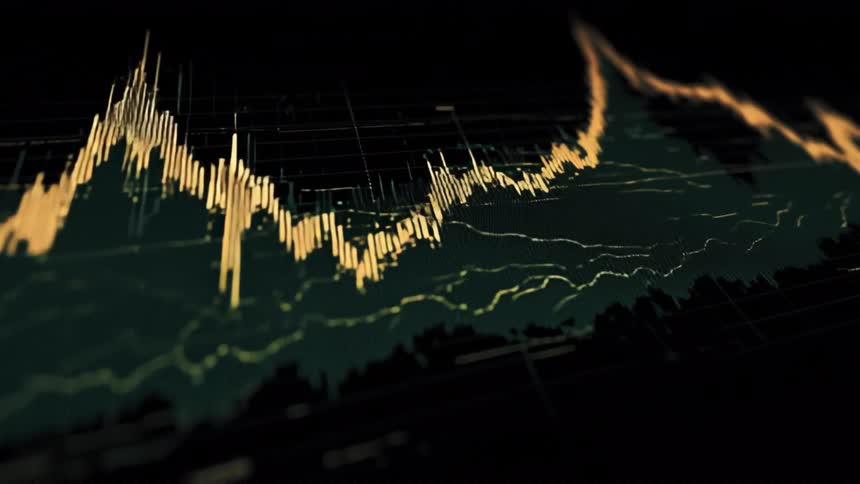
An angled closeup shot captures the dramatic peaks and valleys of a digital financial analytics chart with glowing yellow and green lines
A close-up view of an animated scientific scatter plot displaying complex protein data on a computer screen
A green rising digital bar chart appears on the computer screen symbolizing financial freedom and success due to economical growth and an upward trend of the global economy and digital stock markets and crypto trading platforms
A black screen with various codes in different colors flashing by rapidly
White lines curve and cross each other across the screen
Abstract animation of futuristic, digital microbe-like particles glowing and glitching on a dark grid
A television screen with static is displayed
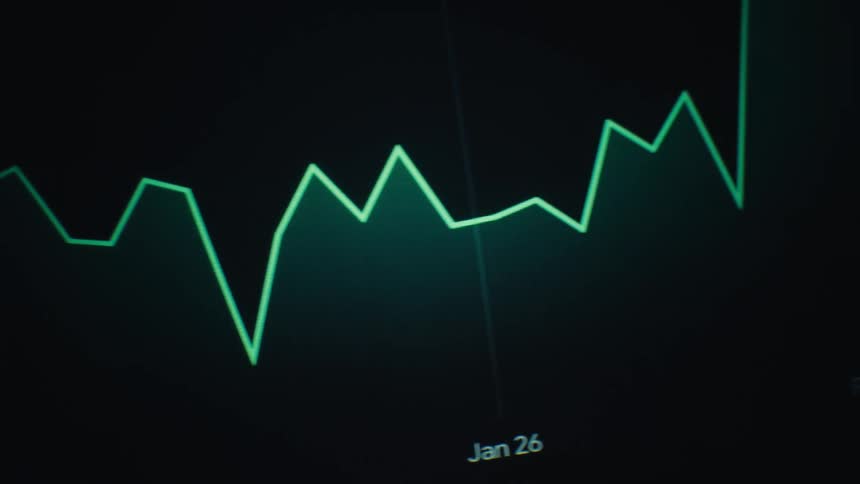
Closeup of a screen displaying a fluctuating line graph
A person monitors frequently changing graphs on a screen
A close-up of a business analytics chart loading on a digital screen, focusing on 'Services' and 'Subscriptions'
A line graph is on the long monitor
An interactive 3D data visualization scatter plot with colorful spheres is analyzed on a futuristic interface
A financial graph with an upward trend arrow and bar chart rises on a digital screen, with smoke effects adding a mysterious atmosphere
A medium closeup shot of a monitor screen displays a section of code in a dark theme with bright multicolored syntax highlighting the code includes elements related to machine learning and data visualization such as predicted values a confusion m
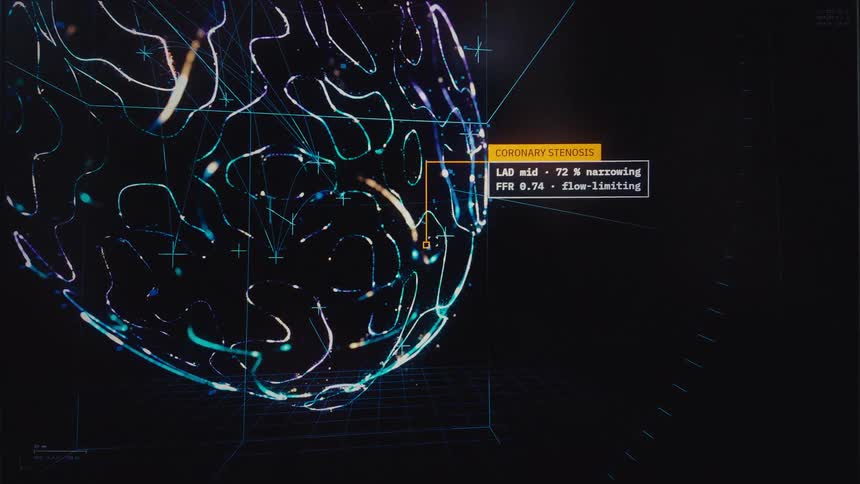
Advanced medical software performs a comprehensive diagnostic scan on a 3D digital human heart, identifying multiple health issues
A digital view of light lines
Light is playing in the distance
Screen displaying a dimensional color graph
Dolly Out Shot of a Blue AI Neural Network - Abstract Data Flow - Machine learning - Nodes and Lines
This abstract clip features a colorful digital pattern that shifts and changes the bright colors including reds greens and blues move in waves and vertical lines reminiscent of a visualizer for a sound wave
A stock market candlestick chart with technical indicators is displayed on a screen
A user navigates a 3D scatter plot on a computer screen, analyzing colorful data points and revealing information in tooltips
Macro close up of a red arrow that moves up across a pixelated screen as a financial trading graph is building beneath it symbolizing economic growth or rising stock prices or crypto currency trading as successful investment
A colorful, stylized animation of a financial candlestick chart displays market volatility on a digital grid
Abstract light trails creating an artistic pattern against a dark background
A macro shot shows a digital network with glowing nodes and data packets moving between connections, visualizing information flow
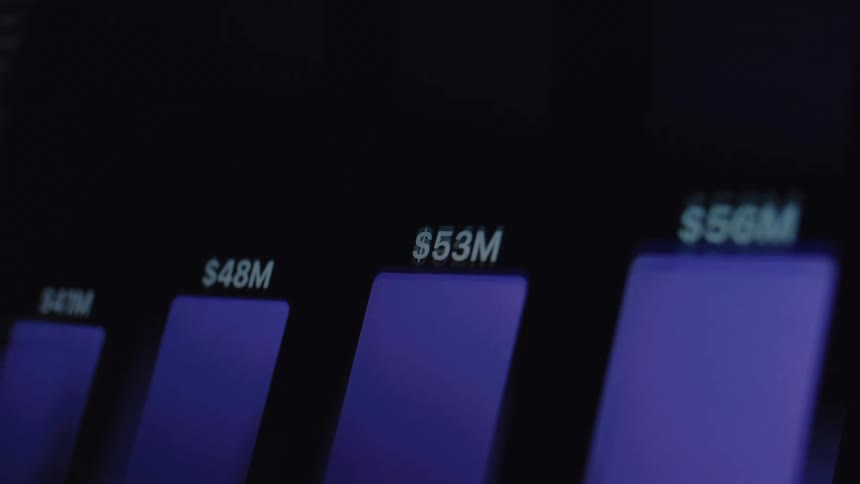
A close-up of a digital screen showing an animated financial bar graph with increasing monetary values
Overlapping line and candlestick charts display intense financial fluctuations
Side Following Shot of a Purple AI Neural Network - Abstract Data Flow - Machine learning - Nodes and Lines
Microscopic view of colorful Erythritol crystals forming
A display showing charts of a stock price
A user manipulates and rotates a 3D scatter plot to visualize and analyze complex data on a computer screen
An animated retro-style green bar chart with digital distortion shows a steep decline on a dark screen
Green dots move across the blackness in warped lines and change to smaller white dots
The lines move on the screensaver
Graphics display on a laptop monitor
A close-up, out-of-focus shot of a blue digital line graph fluctuating on a dark screen, representing stock market data or financial trends
The primary visual is a dynamic jagged trend line that changes color and style throughout the clips in the initial shots it appears as a sharp white line tracing rapid price fluctuations later it shifts to a vibrant green glowing line that follows
Lines on a electrocardiogram monitor show peaks and valleys
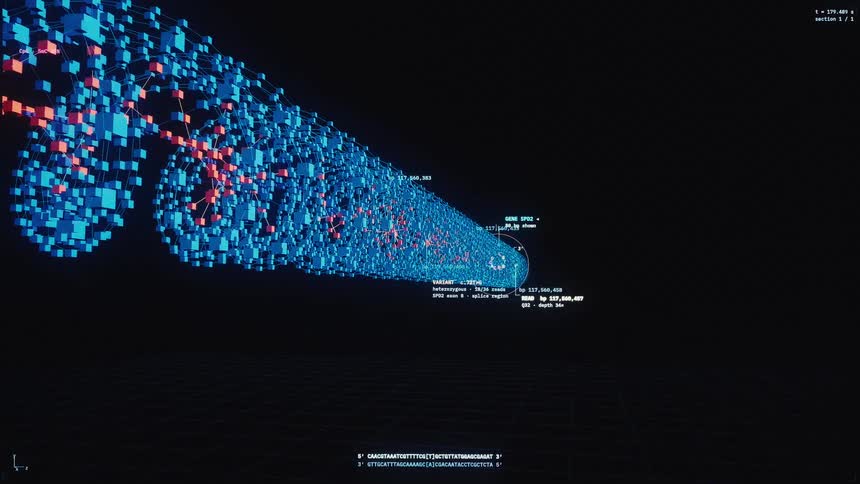
An animated visualization of a DNA strand being analyzed and deconstructed into a vast digital data network
Digital candlestick charts hover over a swiftly moving surface of black streaked with blue and orange shades
A distorted, fisheye view of a computer screen shows a user interacting with a colorful 3D scatter plot, analyzing scientific data
Extreme macro shot of a digital bar chart with a downward-pointing arrow, symbolizing financial crisis, decline, and loss
Snippet of code displayed on a computer screen

Need help finding the
right footage?

Have it delivered to your account within 1 business day.

This is Filmsupply

Our StoryOur FilmmakersArticlesFilmsPopular SearchesAll Categories

FM

A family of brands dedicated to empowering the creative.

FILMSUPPLY

Footage licensing for productions

MUSICBED

Music licensing for filmmakers

STILLS

Image licensing for creatives

© 2026 FM LLC.

Privacy PolicyLicense TermsTerms & ConditionsCareers