Musicbed
Filmsupply
Stills
Contact Us(800) 805-6802
Dolly Out Shot of a Blue AI Neural Network - Abstract Data Flow - Machine learning - Nodes and Lines
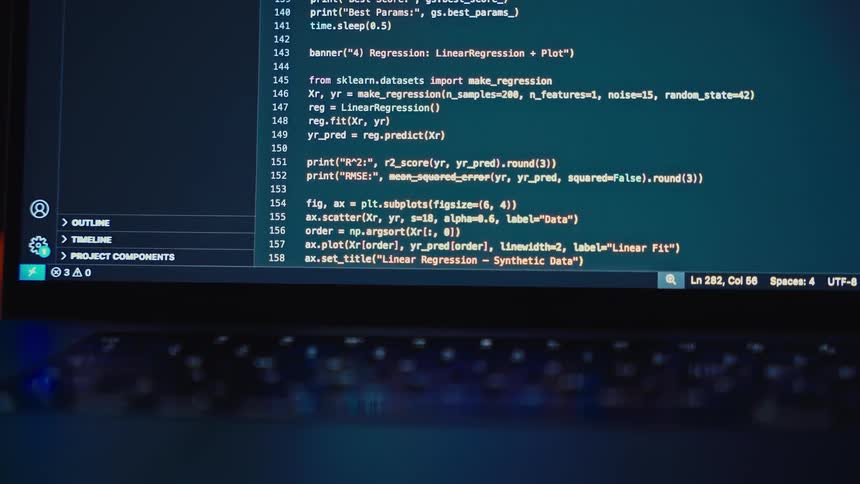
A lowangle wide shot captures a backlit keyboard on a laptop with a dark colorful programming interface on the screen the scene is dimly lit by the glow of the screen and the individual backlit keys
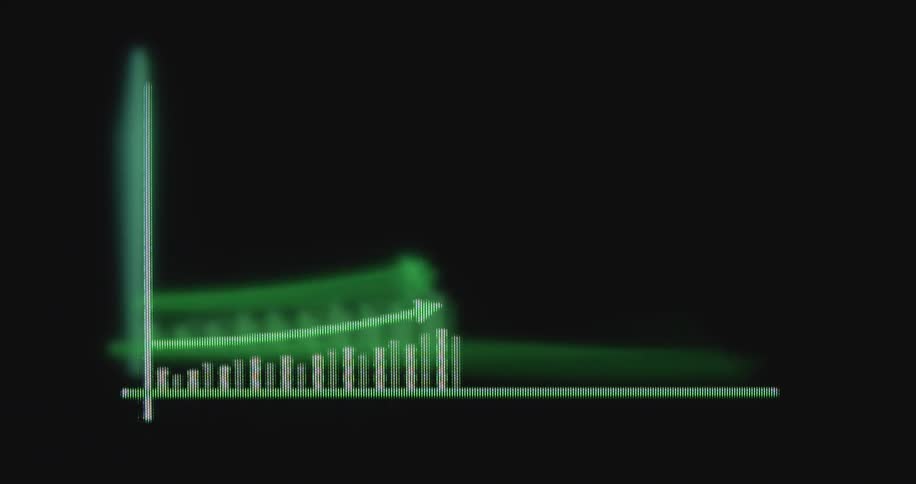
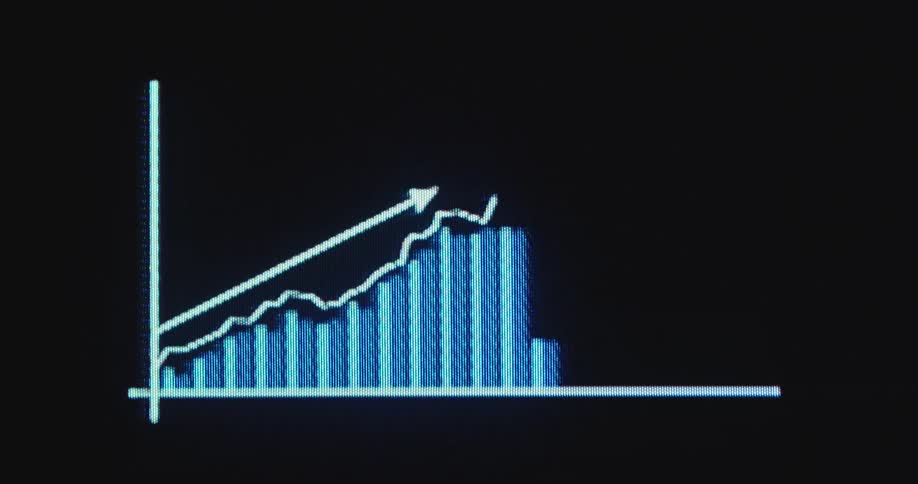
An animated green bar chart on a digital screen illustrates exponential growth with a rising arrow
A screen with red and blue graphs
Computer monitors on a desk are displaying graphs
A smartphone screen displays various stock market charts rapidly changing between green upward trend and red downward trend graphs for different companies and indices
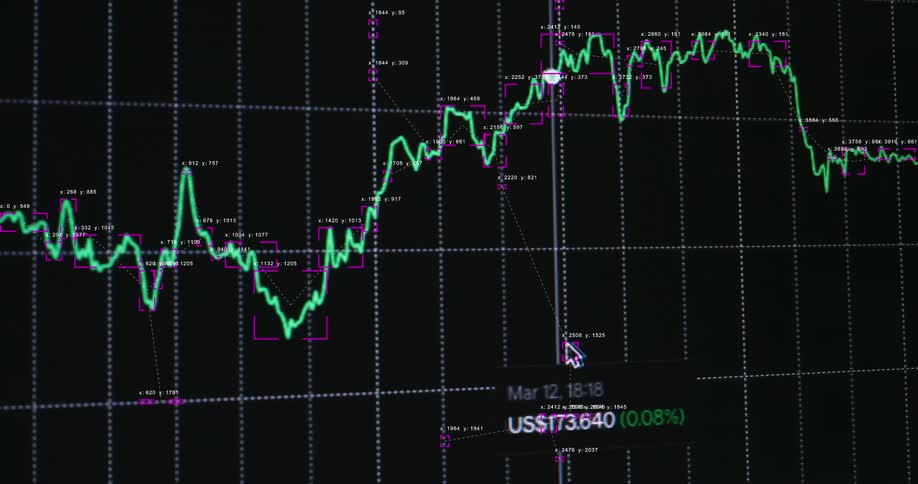
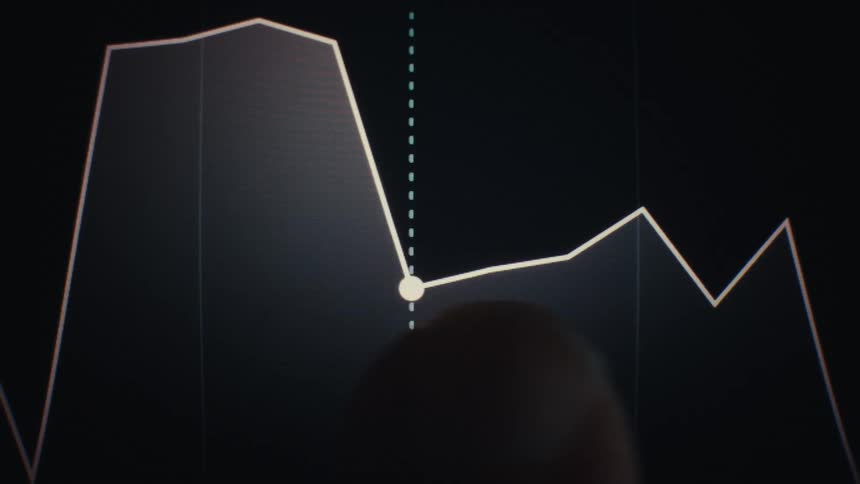
Cursor moves along the graph line on the screen
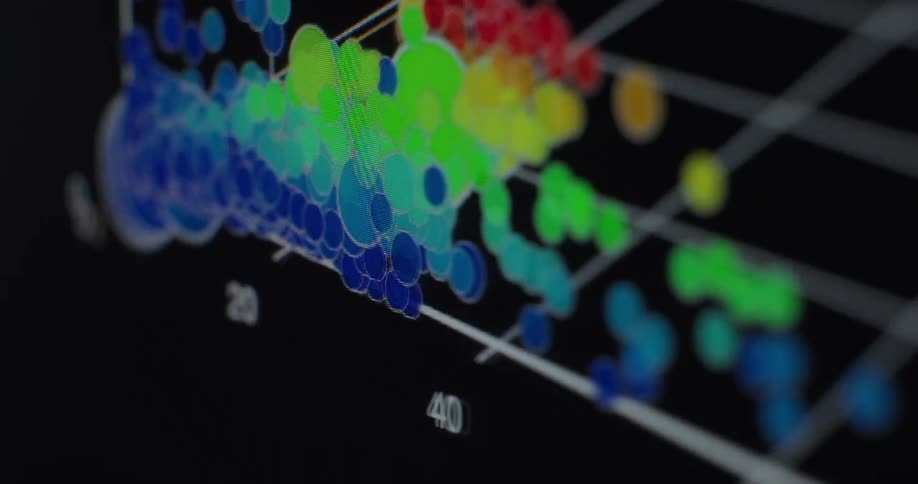
Macro close up shot of a colorful data visualization graph displaying scientific analysis on a computer screen
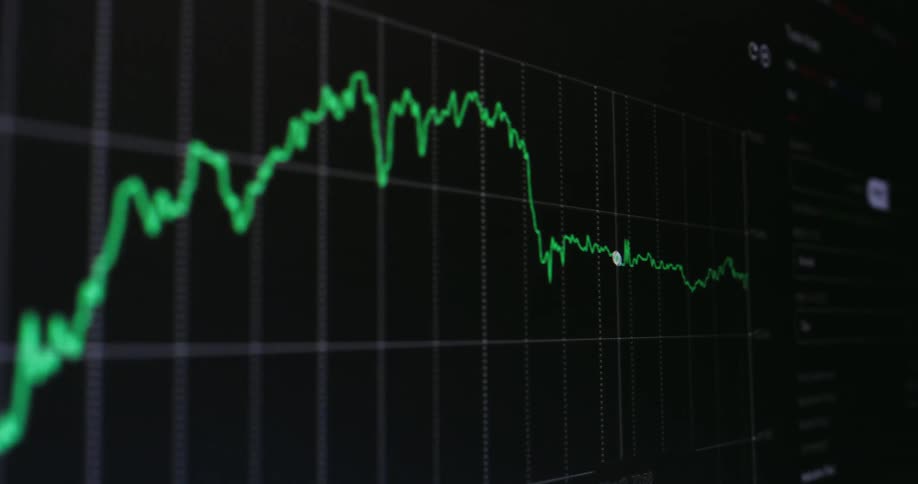
A close-up of a dynamic digital stock market chart shows the fluctuating value of an asset over time with technical data analysis
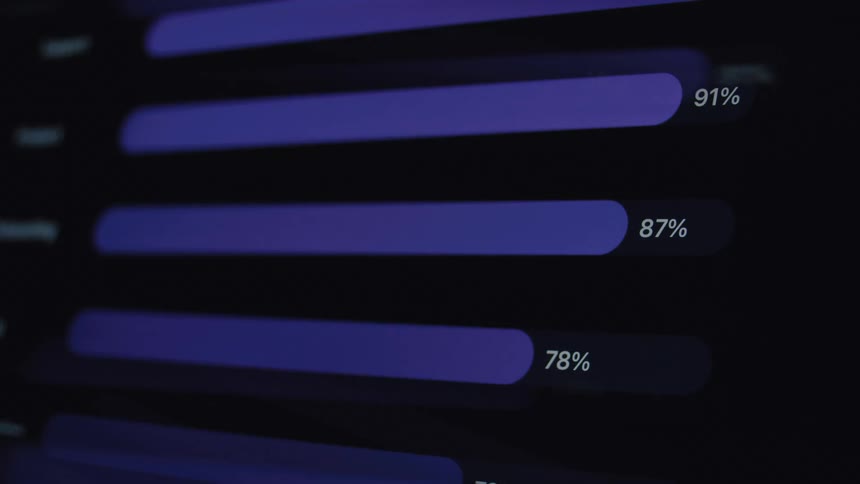
Animated purple bar graphs on a dark digital screen fill up to show increasing percentages, representing data visualization and statistics
The primary visual is a dynamic jagged trend line that changes color and style throughout the clips in the initial shots it appears as a sharp white line tracing rapid price fluctuations later it shifts to a vibrant green glowing line that follows
A person types a series of codes on a computer screen
Futuristic closeup of a computer screen displaying a stock market graph or candle chart with ups and downs and upward tendency representing the digital and modern finance sector
Close up of an electronic screen displaying a trading interface with blue candlesticks against a dark background
Multiple lines and a candlestick chart occupy the same graph on a digital screen as a selection is made
An animated heartbeat is monitored on a retro green grid screen with complex data analysis overlays
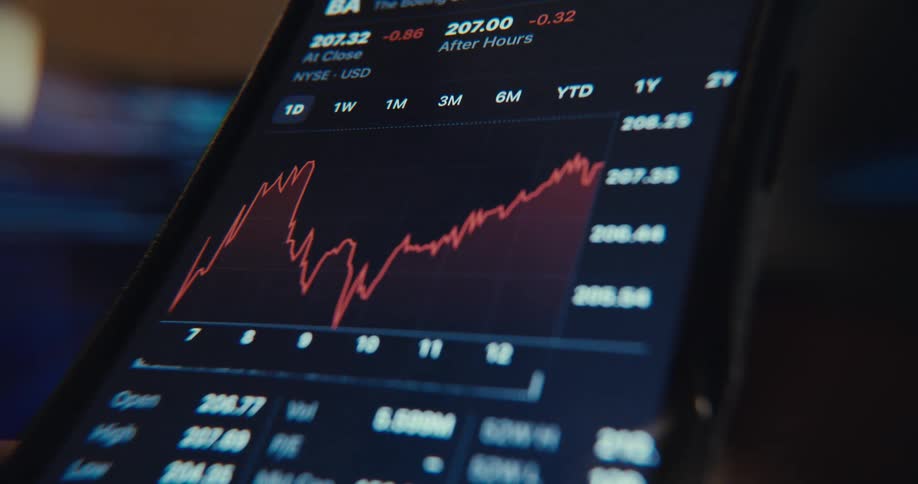
A stock price chart is displayed on a computer screen
A close-up view through a magnifying glass reveals long decimal numbers on a spreadsheet
A close-up of a blue digital line graph showing fluctuating real-time data on a dark screen
A futuristic blue and purple infographic on a screen shows financial data by continent
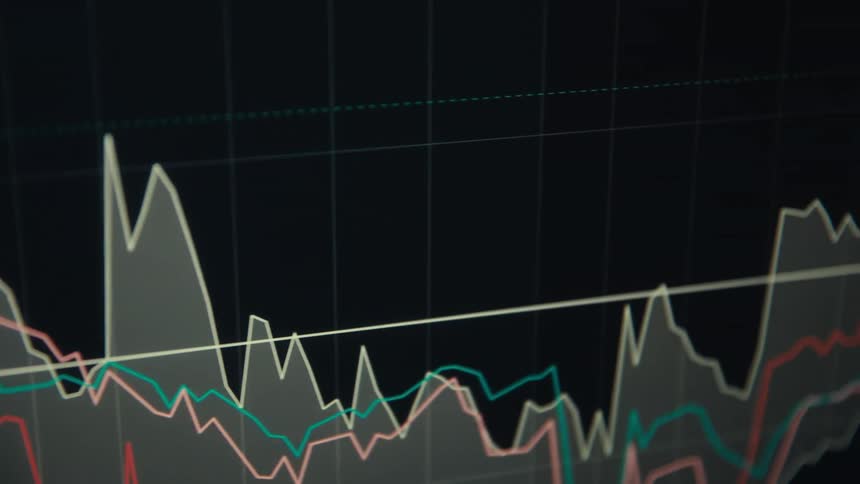
A closeup shot shows a digital screen displaying a financial graph with multiple colored lines representing different market trends the camera pans slowly from right to left revealing the volatile jagged movements of the lines as they shift up and dow
Closeup of computer monitor displaying webpage code
Blue candlestick chart with bars and white trendline arrow displayed on a pixel screen with negative downward price development as symbol for unsuccessful stock trading or bad investment strategies with negative market analysis
Blue and orange financial chart lines displayed on a digital screen
The information on the monitor is shaking and blurry
Reflection on a screen partially obscures a candlestick chart
An abstract and distorted close-up of a rotating 3D scatter plot showing colorful data points being analyzed
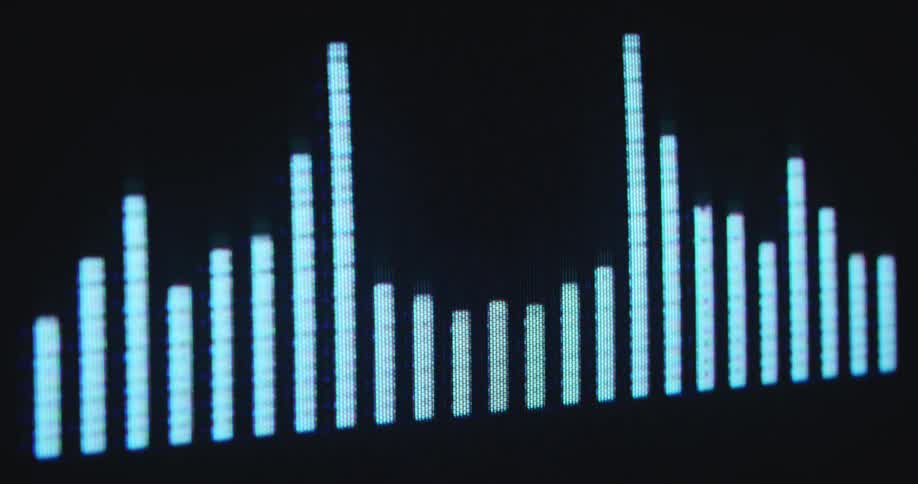
Dramatic wide upward view of a pixelated tube TV screen displaying or showing a digital equalizer with numerous glowing white vertical bars fluctuating across a black background while visualizing the sound of loud pop music
Close up of a blurry device screen displaying a trading interface in green over a dark background
A blurry, out-of-focus close-up of a digital stock market ticker with fluctuating numbers on a dark screen
A red arrow moves upwards across the screen as a bar graph animation is forming beneath it presenting statistical data and visualizing the dramatic increase of prices and production costs
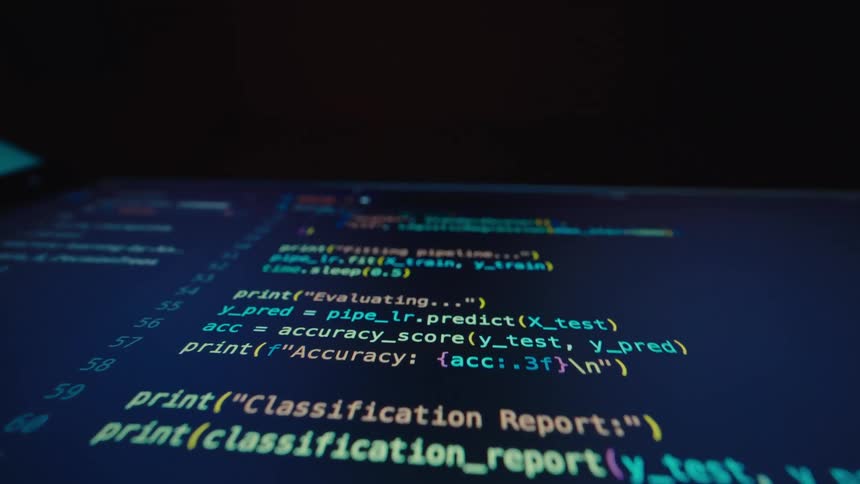
A highangle shot captures a laptop screen displaying a lengthy segment of code in a dark programming environment the text is colorcoded with bright yellow and cyan highlighting featuring variables and functions related to machine learning such as on
Close up of holographic waves on an electronic circuit board component
Graphs flash on the screen
An extreme close up of a mans face wearing glasses
A close up view of financial data charts and graphs displayed on a screen with light distortions
Glowing green and red digital line graphs display financial data on a dark background
Series of binary numbers in red arranged in columns of zeros and ones on a dark screen
Futuristic macro close up of a retro digital CTR screen playing animated graph with a rising line chart and upward pointing arrow overlaying moving black bars representing stock market or business growth with financial success on white background
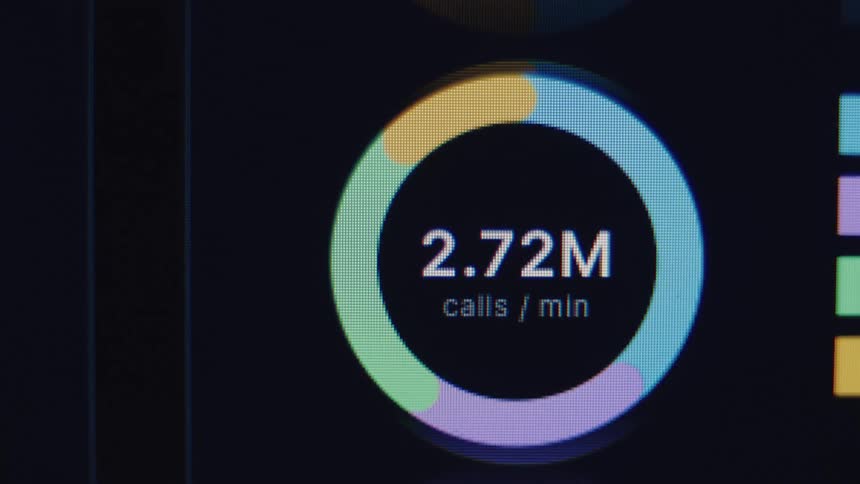
A macro shot shows a digital dashboard displaying real-time analytics of calls per minute, with the numbers constantly updating
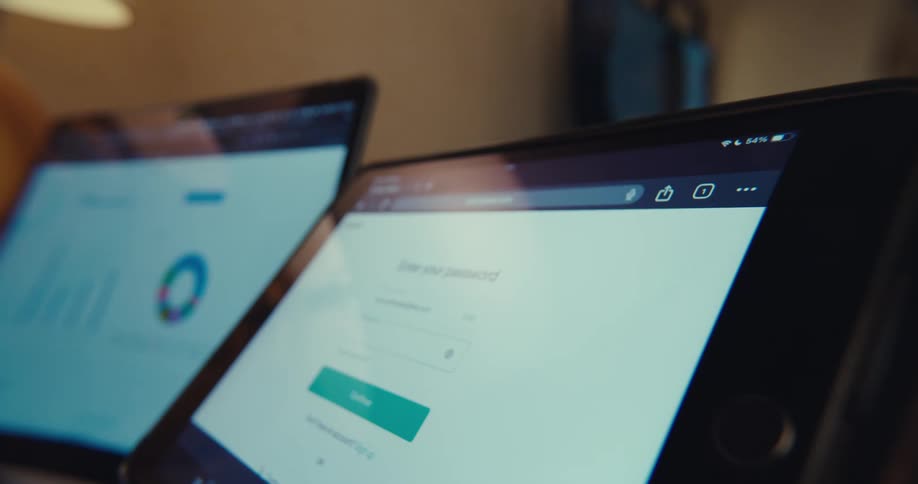
Close up of screens of a tablet and laptop displaying an application sign in page and a chart diagram respectively
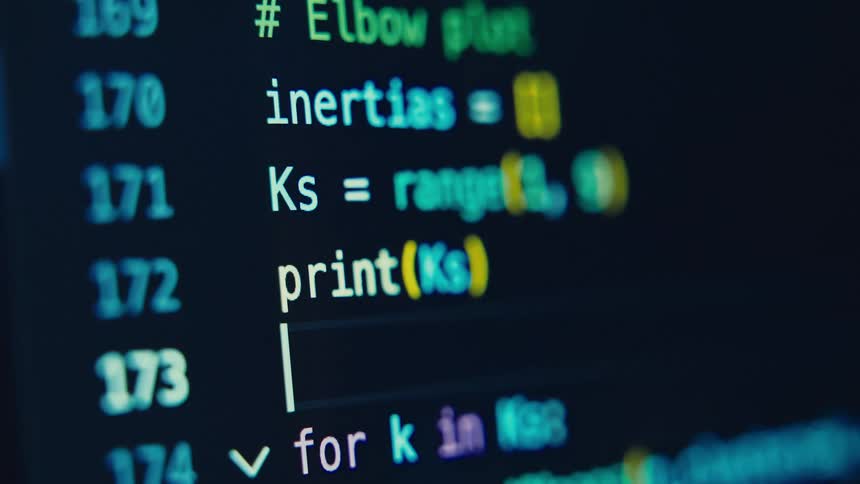
Close up of a computer screen displaying a coding interface in use
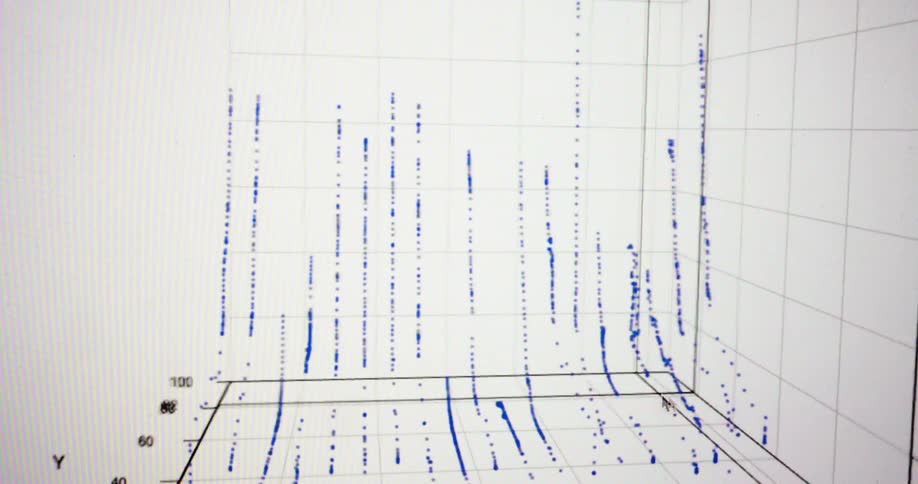
A user manipulates and rotates a 3D scatter plot to visualize and analyze complex data on a computer screen
Red falling trading chart of an online stock broker or crypto exchange in a downward trend during a bear market crash and financial crisis symbolizing failure bankruptcy insolvency and losses caused by declining international and global economy
The monitor has a color coded line chart on display
A wall made up of animated graphs
Pixelated screen of a vintage 90s computer displaying a green graph with an arrow pointing upwards symbolizing the beginning of the digital financial era and the first online trading platforms for buying stocks in the internet
A close-up, out-of-focus shot of data scrolling quickly up a bright computer screen
Finger points to a highlighted point on a line chart showing value variation
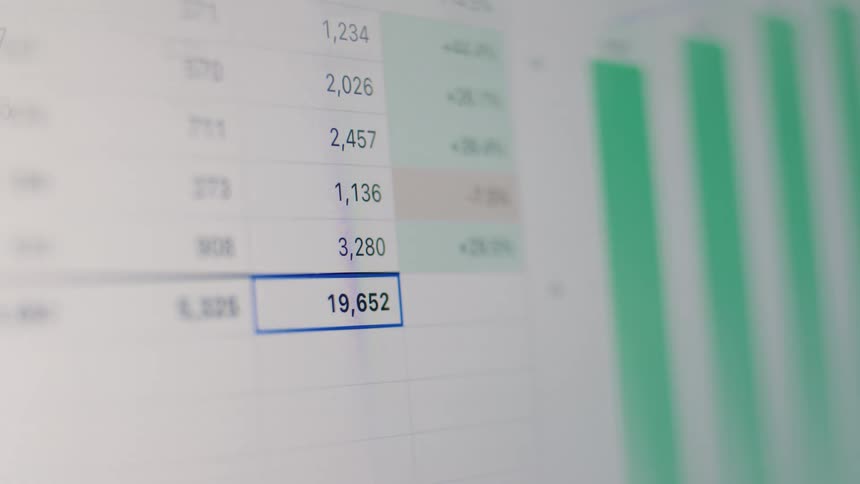
A person enters numbers into a spreadsheet on a computer screen, culminating in a final total
Financial chart with colored lines and areas showing market fluctuations
The computer screen is full of code
A blue and white graph or chart animation presents successful business data and a growing economy as the arrow moves upward with a positive price development due to healthy financial markets
Close-up of a green audio waveform on a digital timeline with a red playhead scrolling across
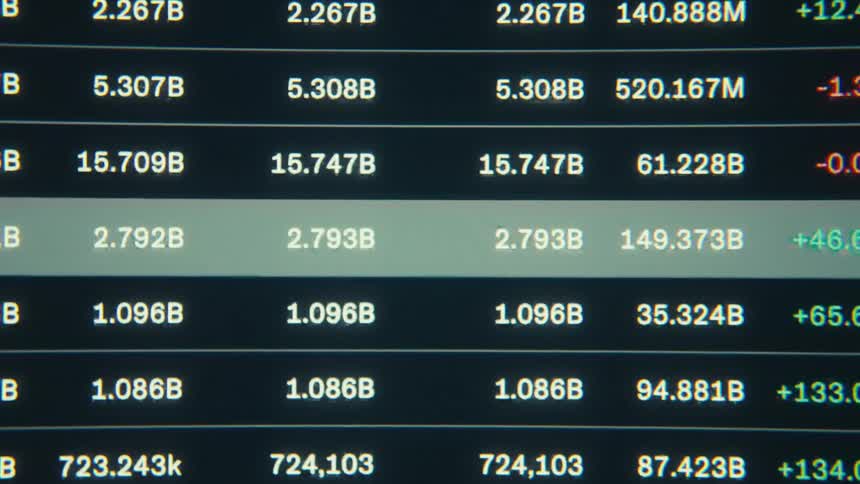
Digital quotation table showing values percentage changes and market charts
A line graph is displayed on a monitor on the side of a building
Computer monitors are showing graphs and data
Sound bars of a digital EQ or Equalizer rise and fall on a screen as a symbol or visualization for sound in the digital world of online streaming platforms and audio books played on display devices such as computers or smartphones
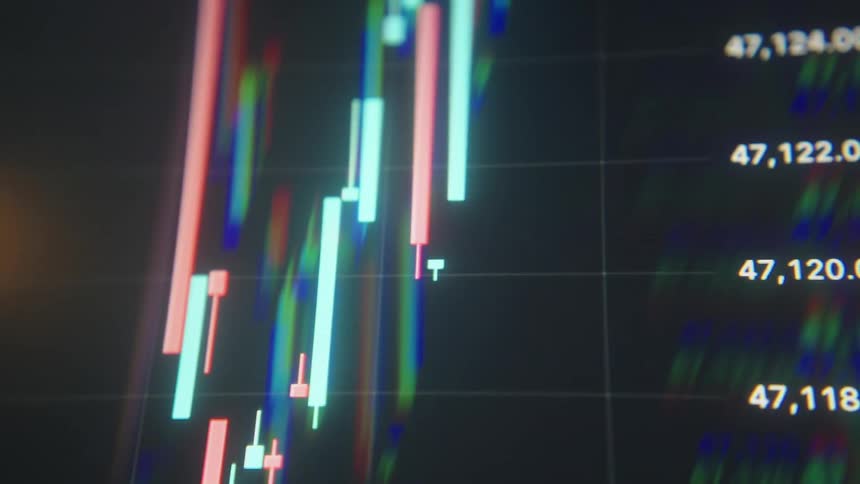
Chart of rising and falling candles against a blurred background
A close-up of a digital counter on a screen rapidly increasing to forty-eight thousand, showing successful growth
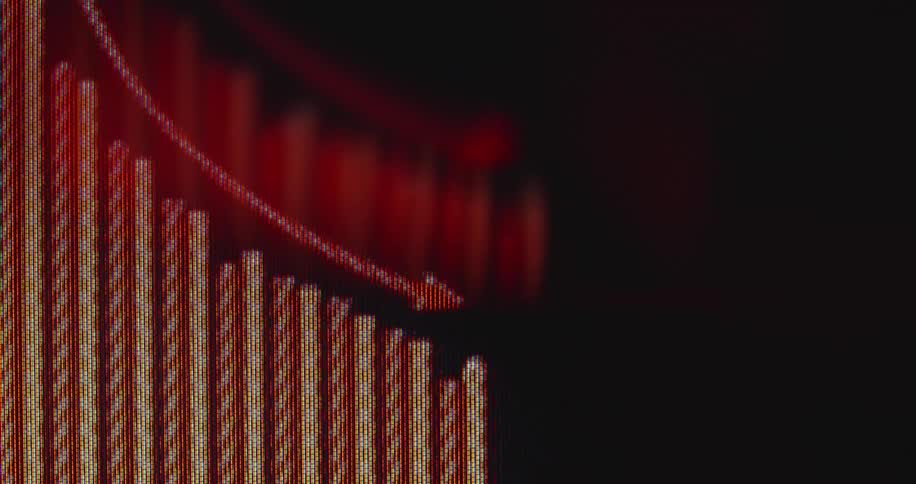
An animated red bar graph with a downward pointing arrow trends down, symbolizing economic recession
A programming code is displayed on a laptop screen
A series of glowing teal numbers and dots stream horizontally across the screen mimicking the look of flowing computer code or a highspeed data transmissionthe characters vary in brightness and size with a soft motion blur effect that creates a sens

Need help finding the
right footage?

Have it delivered to your account within 1 business day.

This is Filmsupply

Our StoryOur FilmmakersArticlesFilmsPopular SearchesAll Categories

FM

A family of brands dedicated to empowering the creative.

FILMSUPPLY

Footage licensing for productions

MUSICBED

Music licensing for filmmakers

STILLS

Image licensing for creatives

© 2026 FM LLC.

Privacy PolicyLicense TermsTerms & ConditionsCareers