Musicbed
Filmsupply
Stills
Contact Us(800) 805-6802
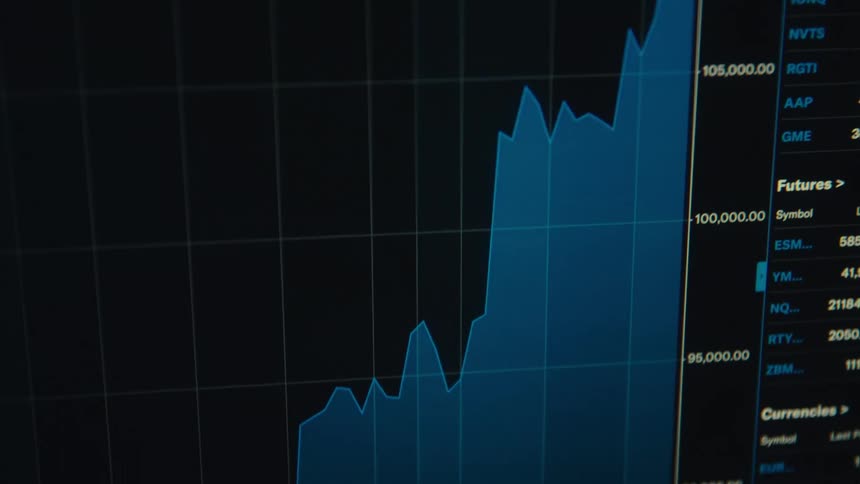
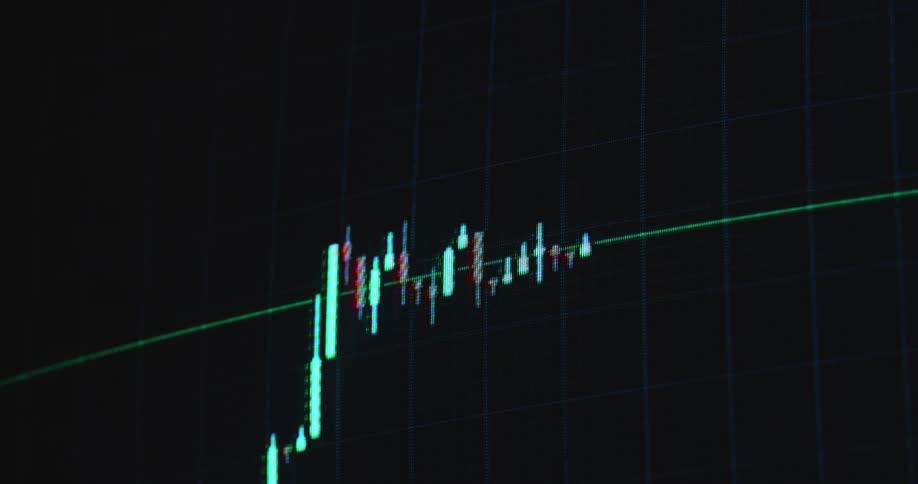
A graph of fluctuating stock data displays on a dark digital screen
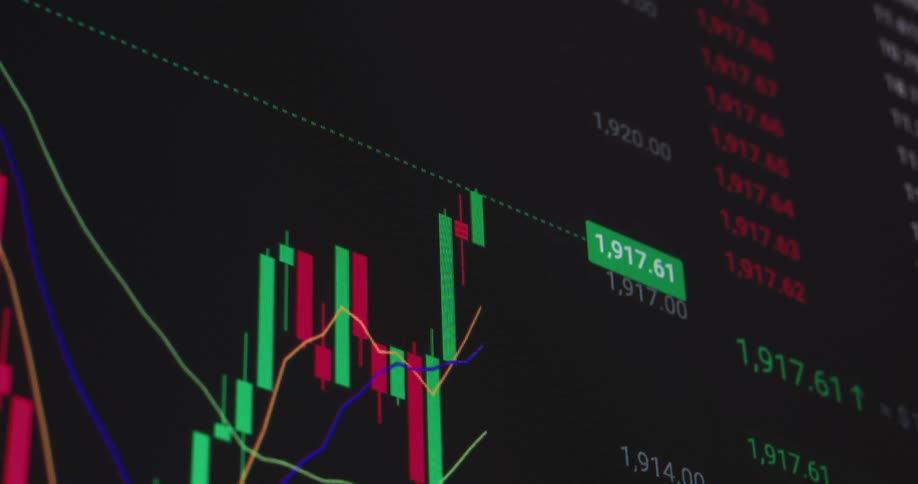
A digital screen showing stock market price chart
Numbers and a line chart are on the computer monitor
A finger scrolls a touch screen
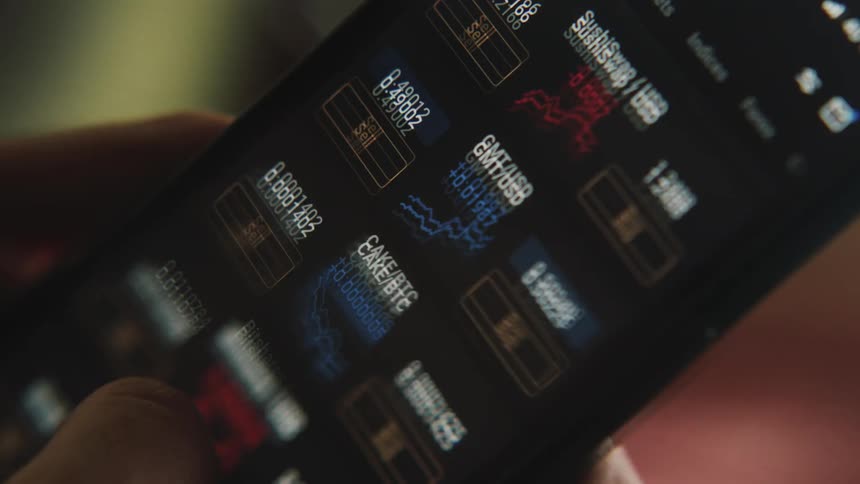
Close up of a device screen displaying a trading interface table scrolled through
A macro close-up of a digital financial chart displaying the 24-hour high price for a stock or cryptocurrency
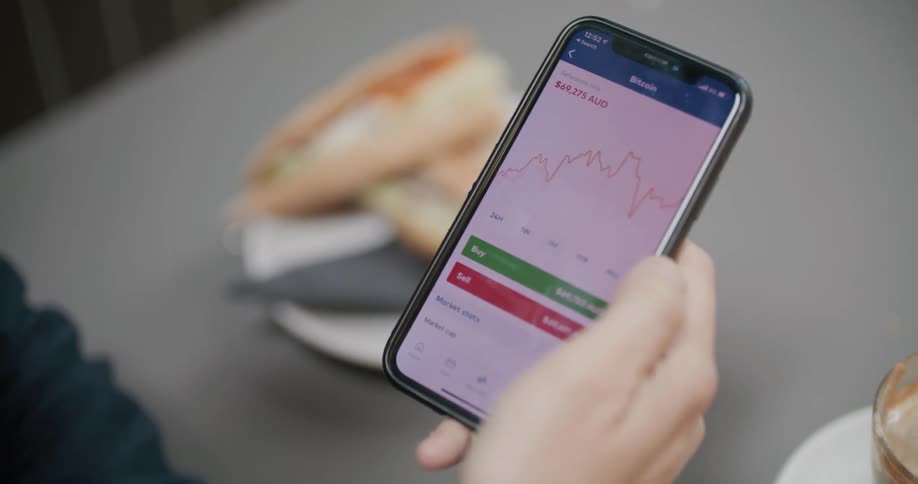
A person is scrolling quickly on their phone
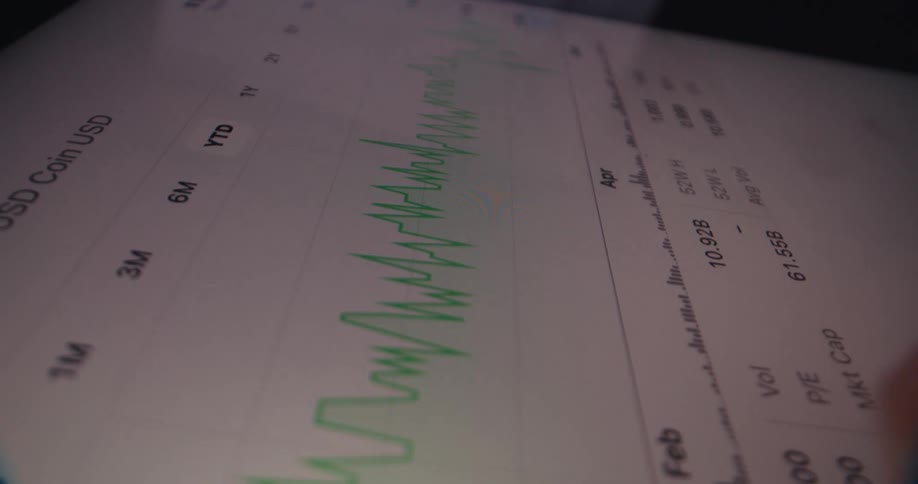
A financial analyst tracks cryptocurrency price movements on a laptop in their office, with the camera slowly zooming in on the chart
Screen displays the values and the relevant plot of changing stock data
Close up of a physical bitcoin currency placed vertically in a rotating diamond structure
Numbers grow on the graph displayed
Futuristic closeup of a computer screen displaying a stock market graph or candle chart with ups and downs and upward tendency representing the digital and modern finance sector
A glowing orange bitcoin symbol sits on a digital microchip of a computer system or mainboard symbolizing crypto computing power in a decentralised network while mining blocks of the crypto currency and validating transactions
The candlestick trading chart or graph steadily rises with a positive upward tendency and trend showing the price development of the MSCI World or S&P 500 or another ETF as a store of value and protection against inflation
Person scrolls data and graphs on smartphone screen
Piles of round coins with the letter b on them sit on a wooden surface
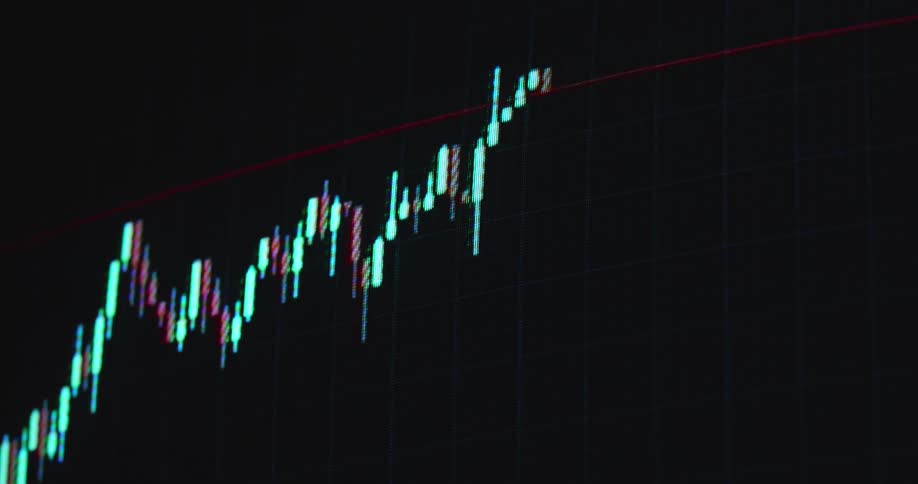
A financial chart displaying colorful candlestick patterns indicates market trends and price movements
The numbers scroll very fast on the monitor
Data lines connecting to an abstract orange bitcoin symbol against a black background as information flows and a block of BTC is being mined while transactions are validated in the network based on blockchain tech and decentralization
A line graph is displayed on the monitor
A stylus pen points to and scrolls through various financial figures cryptocurrency market caps for usdt and xrp and fluctuating line graphs displayed on a dark digital screen in a dimly lit room
Extreme macro close-up of a pixelated candle of candlestick trading chart changing between the colors green and red as symbol for volatility and uncertainty in the financial markets while the price of the stock or cryptocurrency rises and falls
Handheld macro close-up of bullish financial market chart or candlestick trading graph on black screen displaying the UI of stock or crypto broker application or platform as the price surges and the value of the asset increases during investment bull run
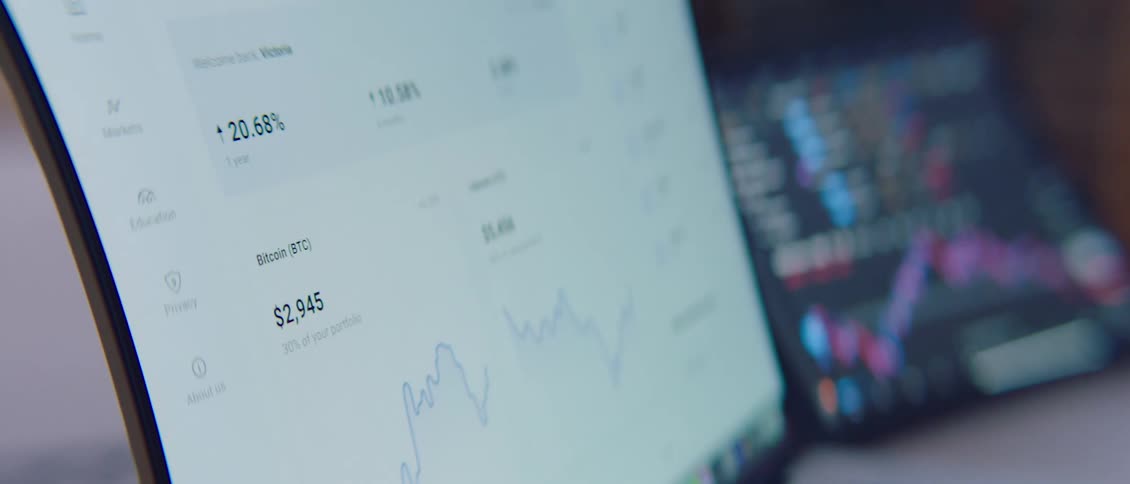
A man and woman collaborate while analyzing financial market trends on a laptop computer
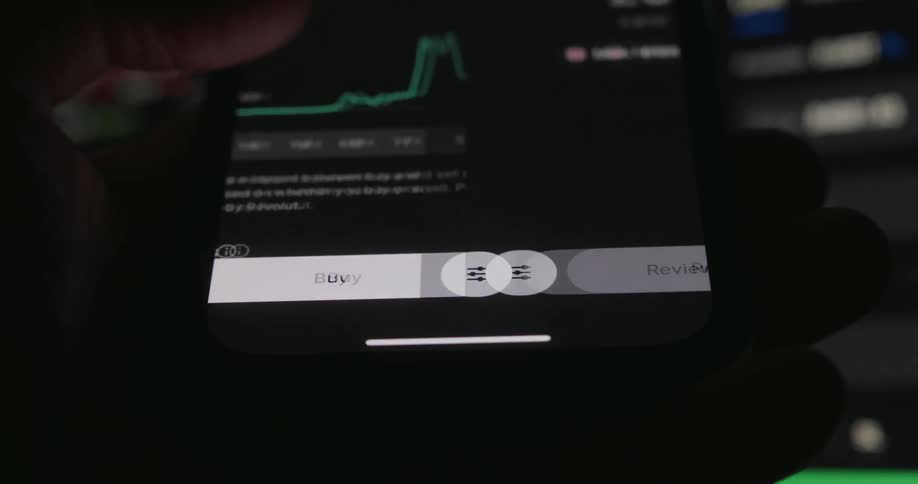
A person presses the buy button on a mobile trading app triggering a transition to the order review screen beneath a rising financial chart
Collection of gold colored coins with an upper case b on each of them
A close up of red and green lines on a graph
Black swan event hits global economy or financial markets causing crash crisis or meltdown and stocks and shares or other investments collapse into red digits or figures causing panic and massive losses followed by economic recession and bear market
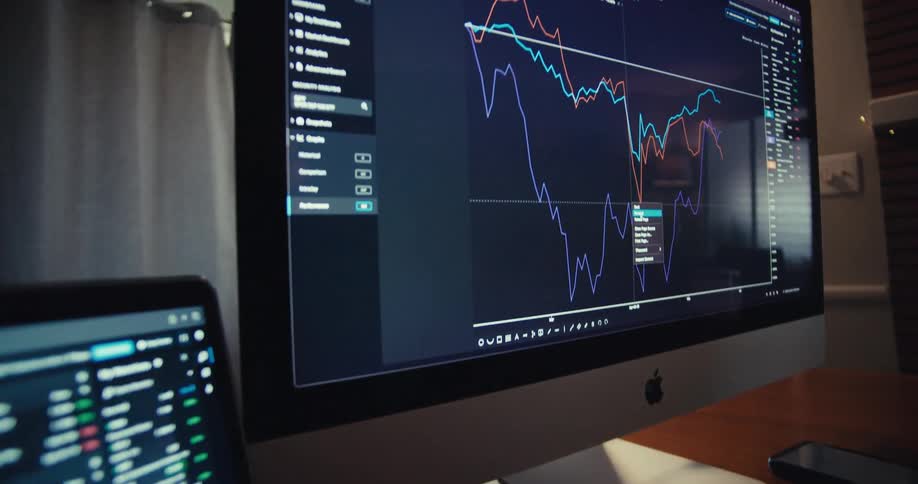
Line graphs and information are displayed on the computer screens
A man using a smartphone screen to look at graphs
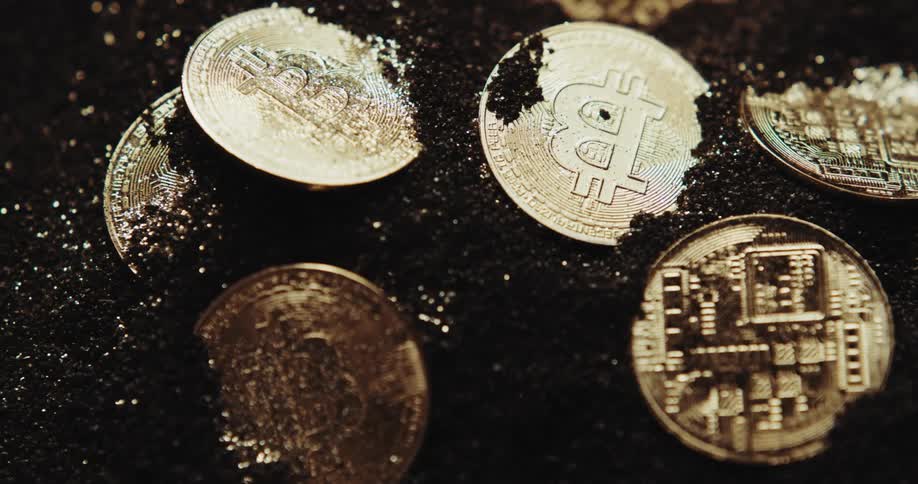
Several golden colored coins are buried in a dark granular powder and one is upright
A macro close-up of a blue digital stock market or cryptocurrency chart on a screen showing real-time price volatility and fluctuations
A bullish bull flag chart pattern is displayed on a dark monitor as the red and green candlestick candles form sideways consolidation before breaking resistance for a massive move to the upside with positive price development and profit in a bull run
A view of a coin spinning
A close-up of a live stock market candlestick chart displays fluctuating financial data on a digital screen
The tablet is scrolling information
The graphs change on the computer display
Line graph changes as the numbers in the data change on a digital screen
A person scrolling on a smartphone
Stacks of gold plated bitcoin coins shimmering in the light
Blue and orange financial chart lines displayed on a digital screen
A candlestick chart or trading graph animation showing a stock price or crypto currency rising over time with exponential growth and a positive trend or development on a dark computer screen with RGB pixels as symbol for a growing shares or bond market
Close up of the shiny engraved surface of golden bitcoin physical coins over a reflecting surface
A macro shot of a digital screen displays the volatile movement of stock market prices
A close view shows blurry digital graphs and stock market data with red and green bars moving quickly across a dark screen
A screen shows a financial chart with green and orange bars moving up and down
A person looking at graphs on a smartphone
A shiny gold coin
A shallow depth of field close-up captures a vibrant, fluctuating candlestick chart on a digital financial trading screen
A number of shiny coins with the bitcoin logo on them are partially buried in black powder
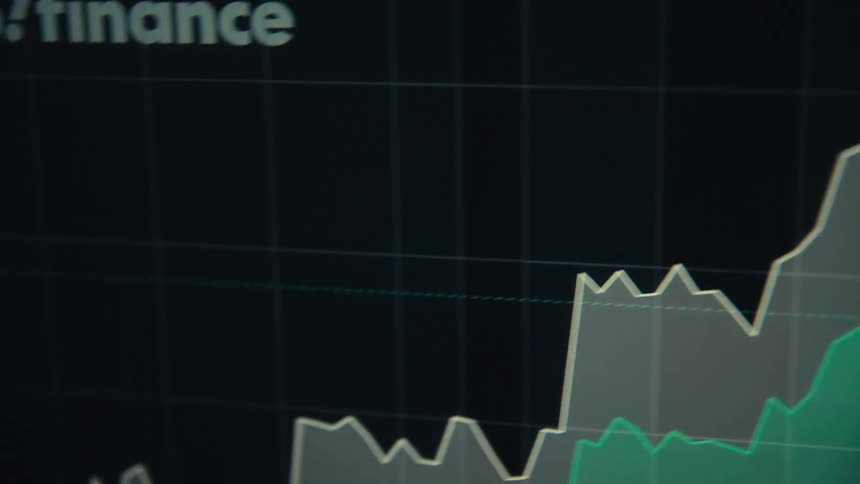
A display showing charts of a stock price
A person spins a large coin with the bitcoin symbol on the surface of a table
A person uses their thumbs to search on a cell phone
A closeup of a persons hand shows their thumb touching a smartphone screen displaying a financial line graph for the stock market
A graph of orange lines
A closeup view of a stock market chart with red and green candlesticks fluctuating
A screen scrolls by
Red and green candlestick chart on a pixelated screen with RGB pixels as the bearish graph breaks resistance to the downside and the market or asset value collapses causing massive losses and volatility due to an unexpected crash
A screen shows a financial chart with multiple lines and bars that fluctuate
Close up of the shiny engraved surface of golden bitcoin physical coins over dark sand
A pixelated smartphone or display device screen or monitor shows the user interface of a finance app or online broker and trading platform for buying and selling stocks and crypto currencies such as Bitcoin or ETH as the trading chart moves up
A digital stock market chart shows a bullish breakout with a green notification indicating a significant price increase
Pixelated candlestick chart on a screen or monitor panel forming a bullish flag pattern while the trading chart analysis shows that the graph is about to break resistance to the upside making the price of the stock or asset go up and increase in value

Need help finding the
right footage?

Have it delivered to your account within 1 business day.

This is Filmsupply

Our StoryOur FilmmakersArticlesFilmsPopular SearchesAll Categories

FM

A family of brands dedicated to empowering the creative.

FILMSUPPLY

Footage licensing for productions

MUSICBED

Music licensing for filmmakers

STILLS

Image licensing for creatives

© 2026 FM LLC.

Privacy PolicyLicense TermsTerms & ConditionsCareers