Musicbed
Filmsupply
Stills
Contact Us(800) 805-6802
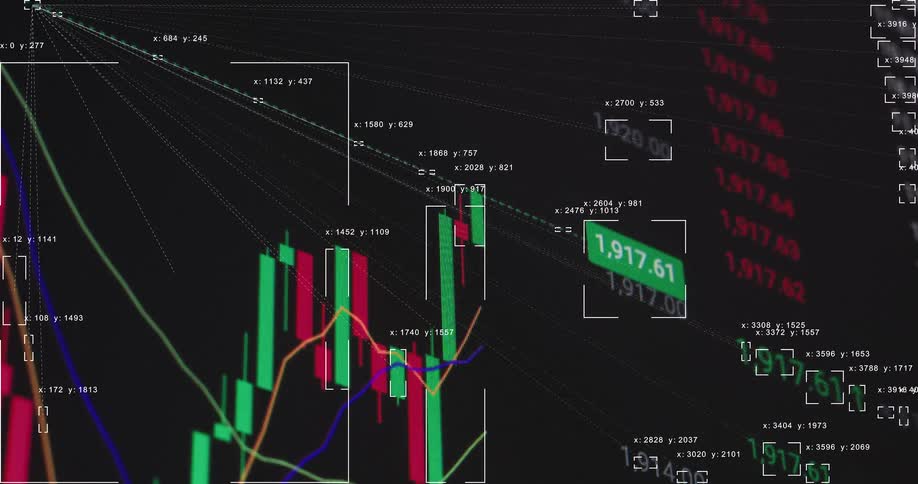
A high-tech digital animation of a financial market graph showing fluctuating prices with data analysis tracking
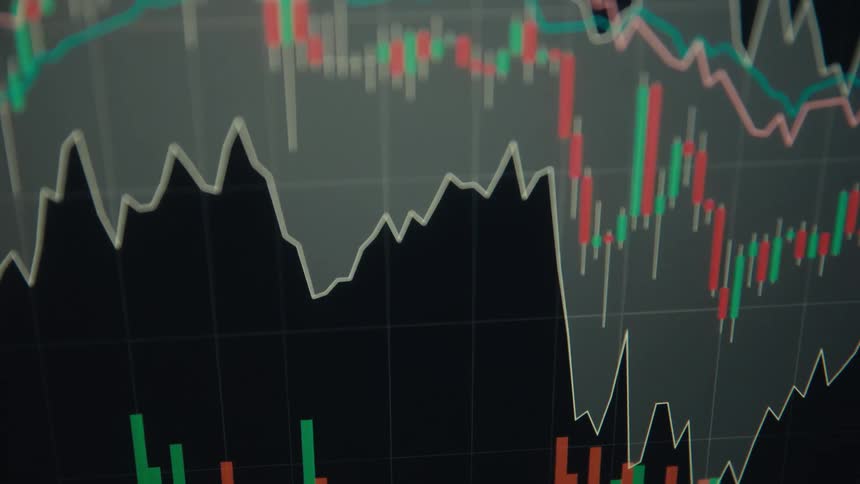
Red candlestick charts indicate sharp market downturn with fast price movement and negative development caused by stock or finance market crash and recession displayed on digital computer screen causing stress and panic while assets lose value
Closeup of a graph of financial data that occasionally shows spots of light
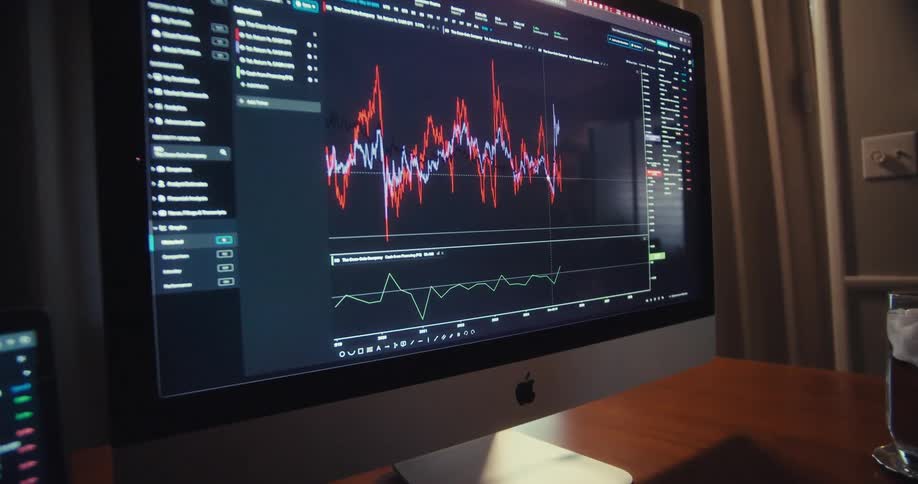
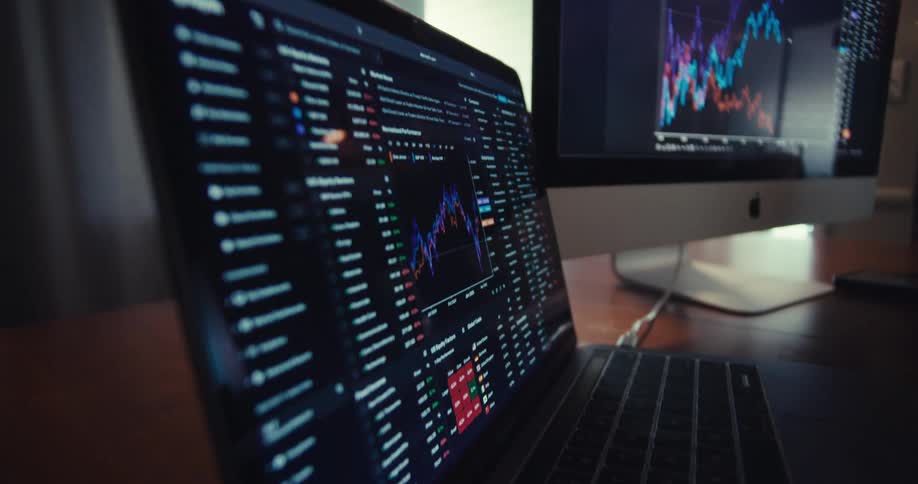
Close up of man trading on a laptop and desktop computer in a room
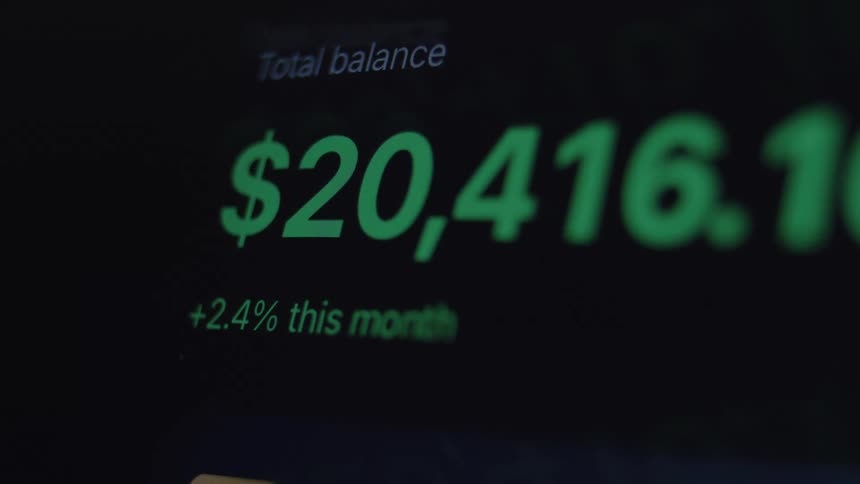
A close-up of a digital financial account showing the total balance rapidly increasing, indicating profit and wealth growth
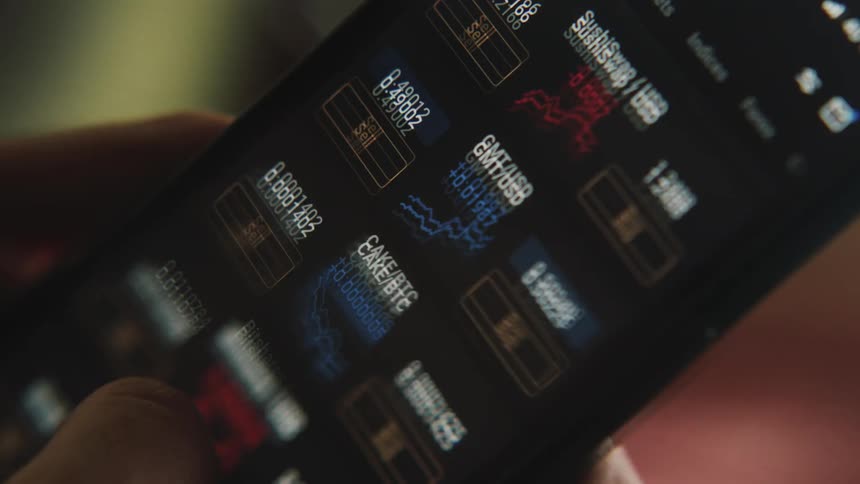
Person scrolls data and graphs on smartphone screen
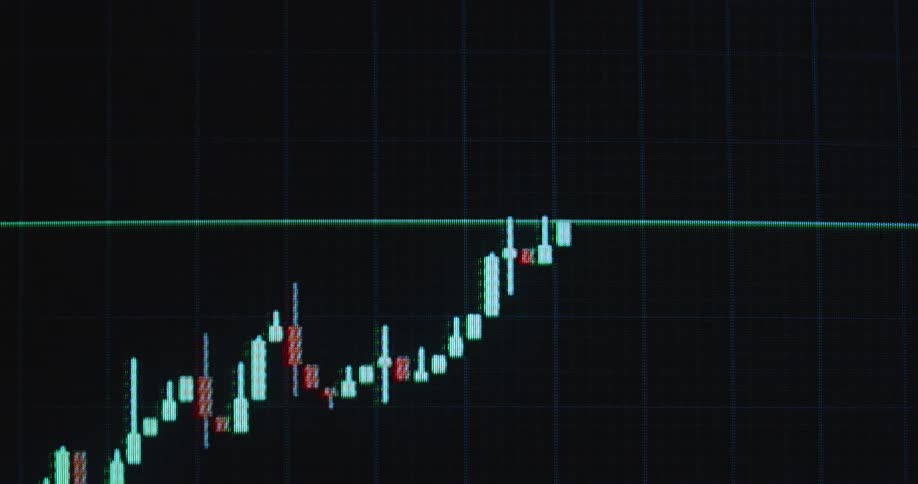
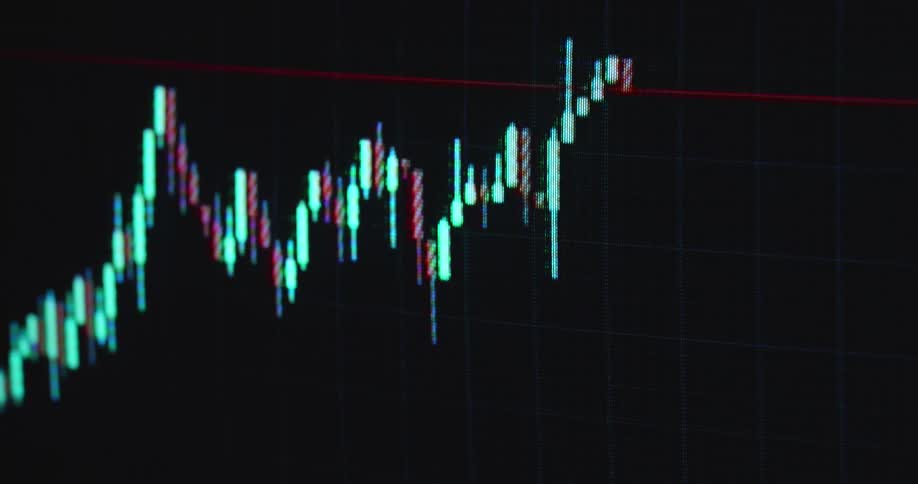
A bullish candlestick chart pattern moves on the computer monitor with visible pixels as the bull flag breaks resistance to the upside causing massive surge and gain for investors and traders trading stocks and crypto currency coins or tokens online
Numbers and a line chart are on the computer monitor
An animated digital line graph shows a volatile stock price rising and falling, changing color from green to red to signify losses
Person selects time intervals and points on graph on phone display
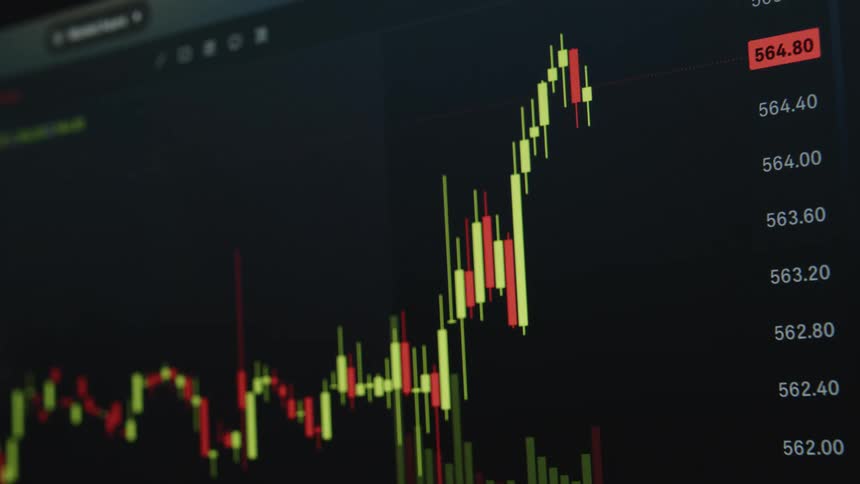
Financial candlestick chart on a screen indoors
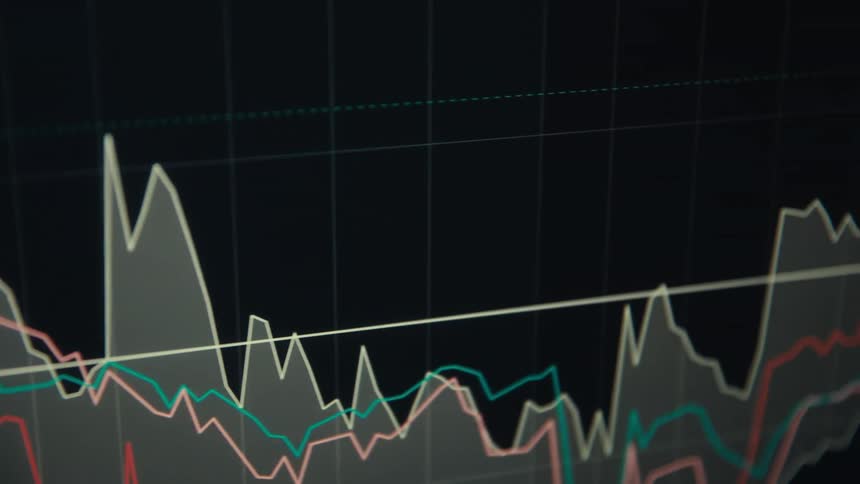
Financial chart with colored lines and areas showing market fluctuations
A binary options chart showing rising and falling movements
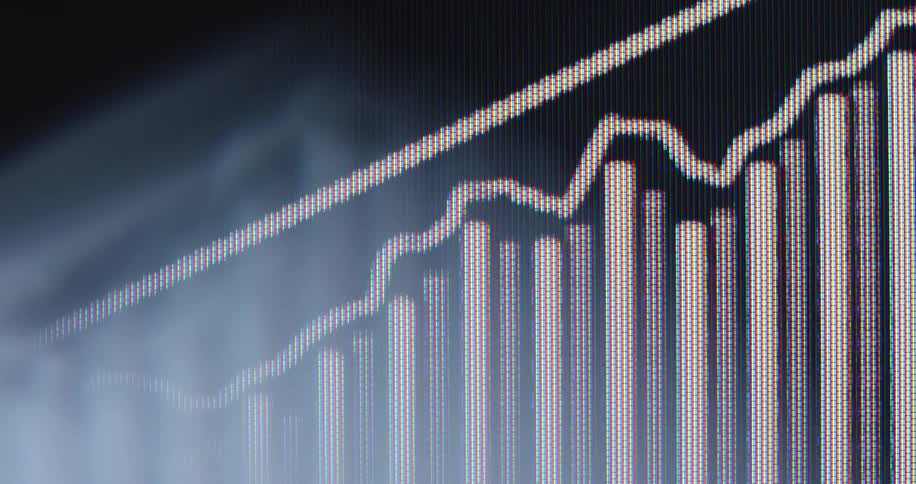
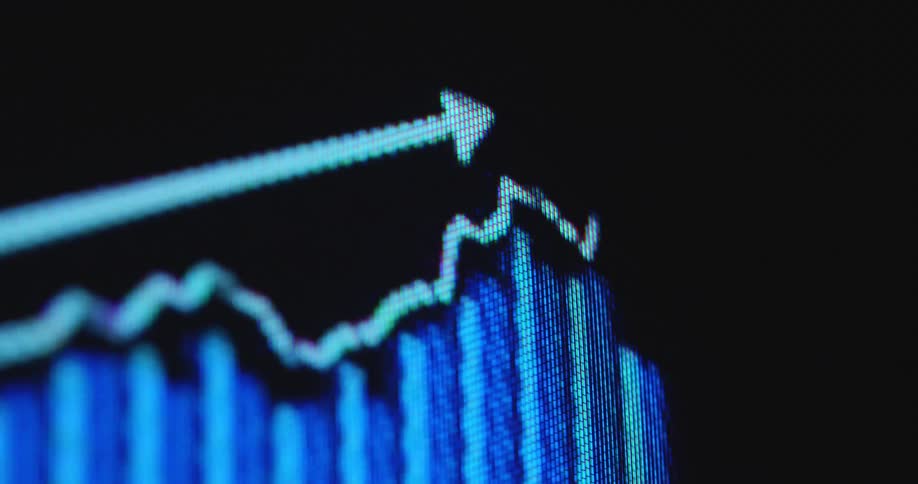
A financial graph with an upward trend arrow and bar chart rises on a digital screen, with smoke effects adding a mysterious atmosphere
Finger interacting with a smartwatch
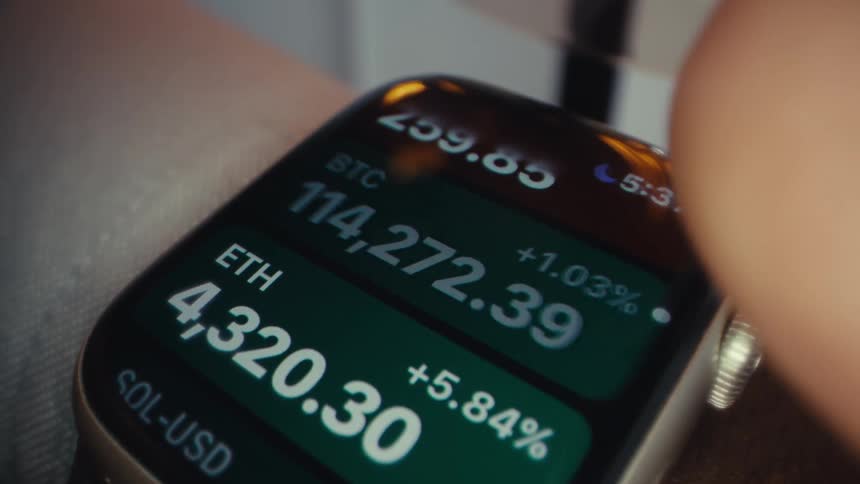
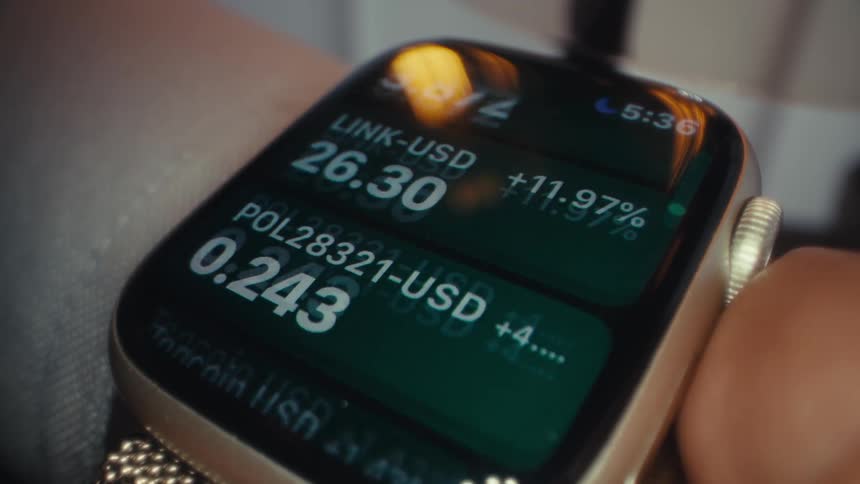
A person scrolls stock numbers on their smart watch
A close-up, shallow depth of field shot of a colorful candlestick graph displaying fluctuating financial market data on a screen
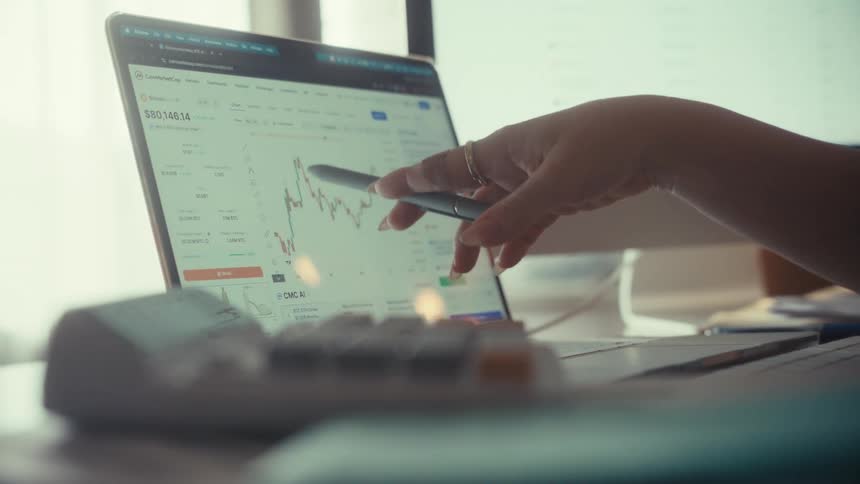
Screen with cryptocurrency prices and stylus pointing
People walk by the line graph on the monitor
A financial analyst points with a pen to a fluctuating stock market chart on a laptop screen while working from a home office
Candlestick and line charts display variations on a financial panel
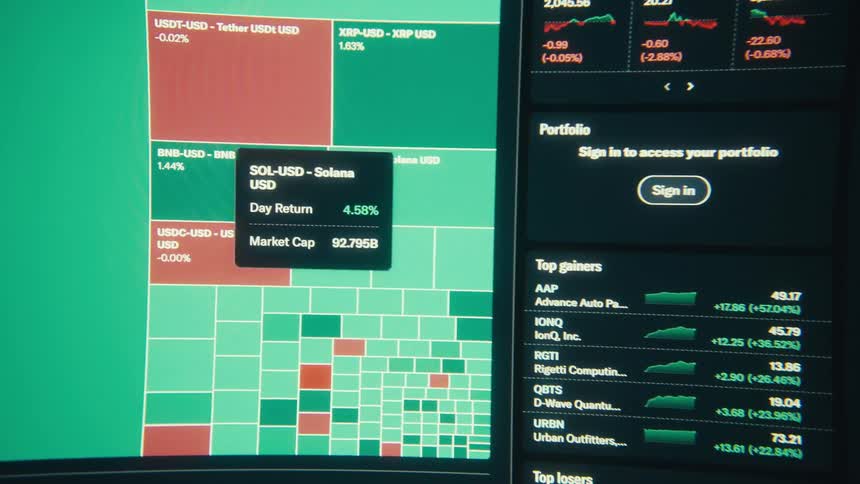
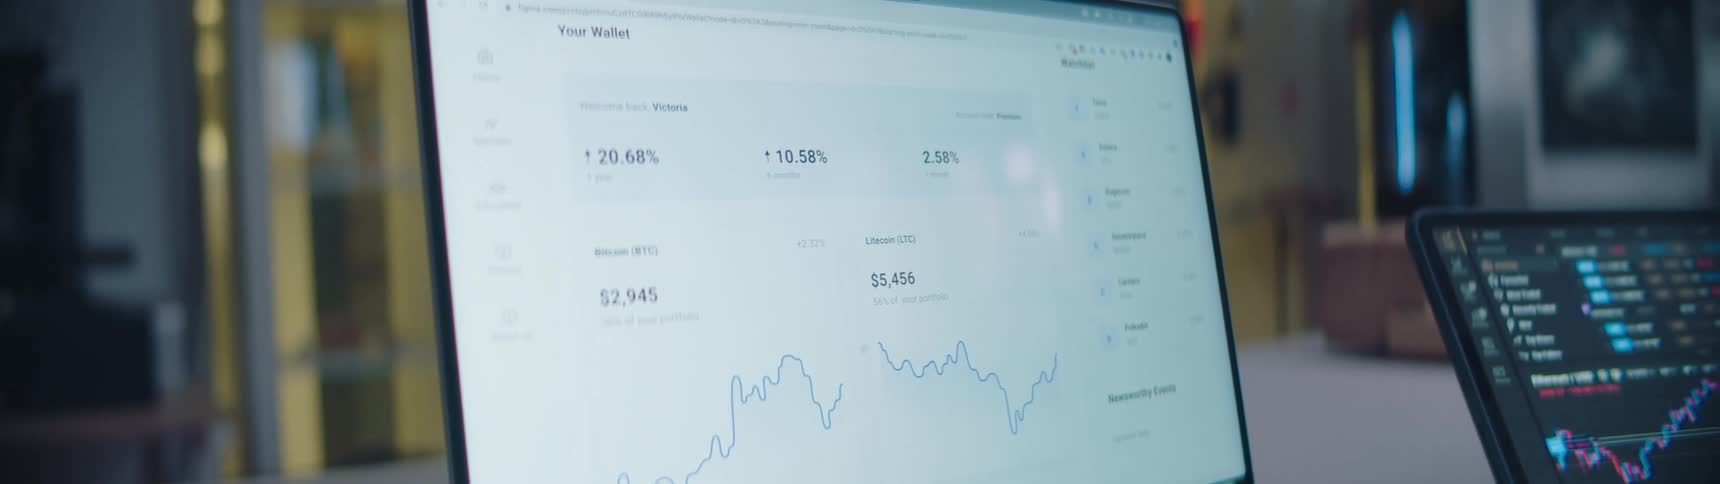
A shot shows a view of a screen with financial data on the left side and a list of top gainers on the right side
The screen displays numbers and percentages
A green graph on a monitor
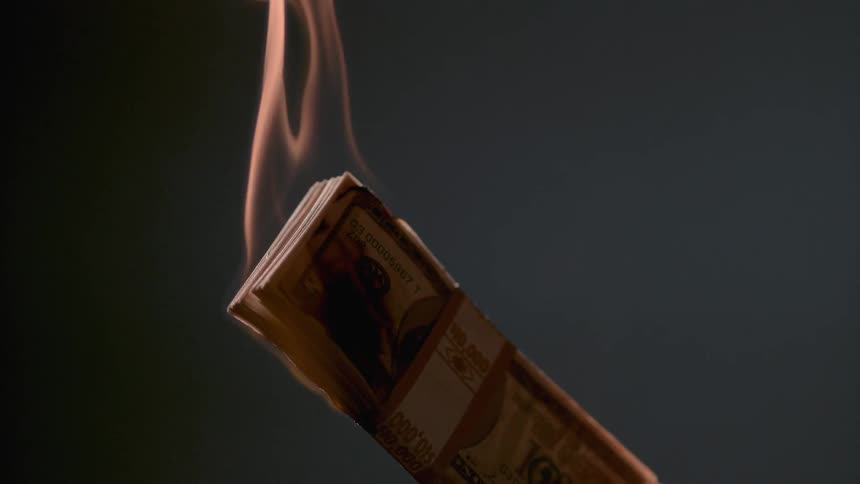
The stack of money is on fire
A financial chart displaying colorful candlestick patterns indicates market trends and price movements
A close view shows blurry digital graphs and stock market data with red and green bars moving quickly across a dark screen
A modern and extreme macro closeup of an old computer screen that shows a dynamic image of a digital United States dollar logo in the colours of the American national flag that is moving and pulsating
Closeup of a computer screen displaying realtime stock market charts and financial data
Close up of several dollar bills
A stack of money on fire in a dark room
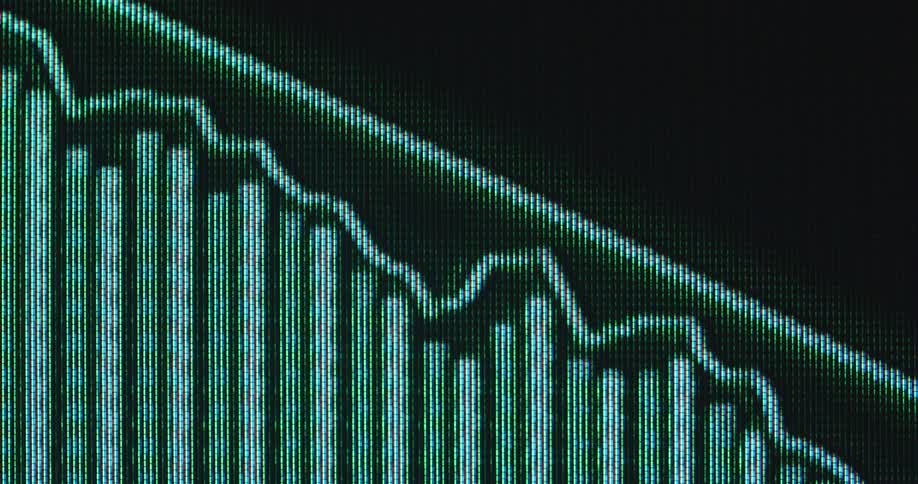
The neon green graph forms an old 90s computer screen showing a vintage user interface of a stock trading platform or exchange as the commodity and equity prices crash and a global recession hits the finance markets
Bundles of banded bills are on fire
Man Coding On Computer In Dark Room
Hectical macro shot with hand held camera movement of a financial candlestick trading chart crashing down into the red digits causing panic sales and fear of a recession or a rug pull as investors lose all of their money to online scammers
A computer screen is displayed with graphs on it
Digital pixelated graph with positive trendline going up showing growth and financial strength of the global or US economy or an economical upward trend while making progress and profiting from business opportunities
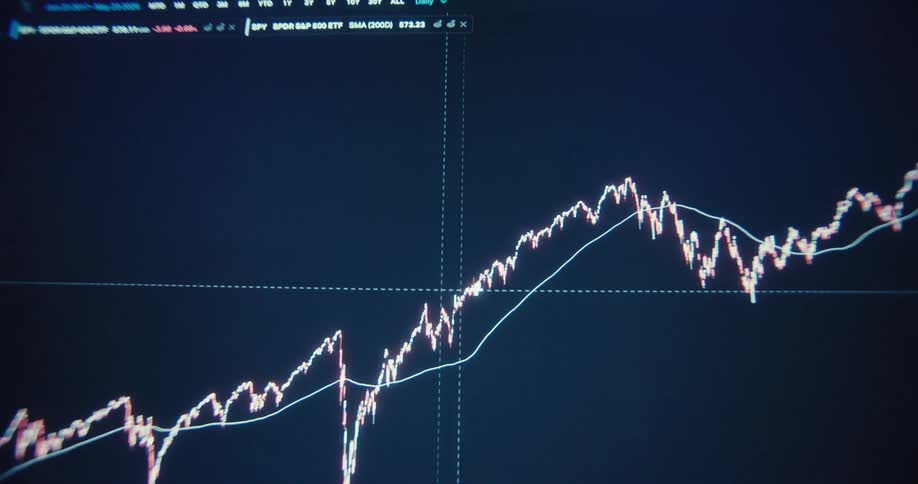
Candlestick chart of ETF or exchange-traded fund with steady growth and positive price performance over a long time span or years as the price of the asset steadily increases with an uptrend and successful value development symbolizing good investment
A pixelated smartphone or display device screen or monitor shows the user interface of a finance app or online broker and trading platform for buying and selling stocks and crypto currencies such as Bitcoin or ETH as the trading chart moves up
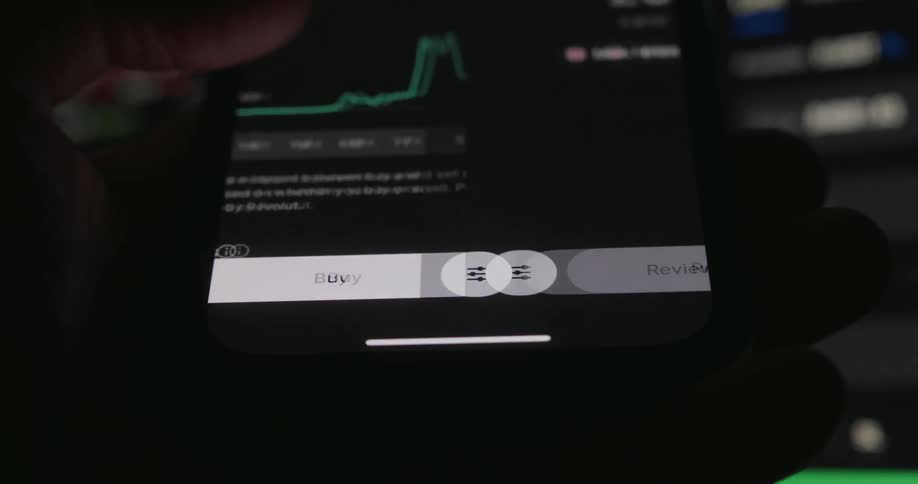
A person presses the buy button on a mobile trading app triggering a transition to the order review screen beneath a rising financial chart
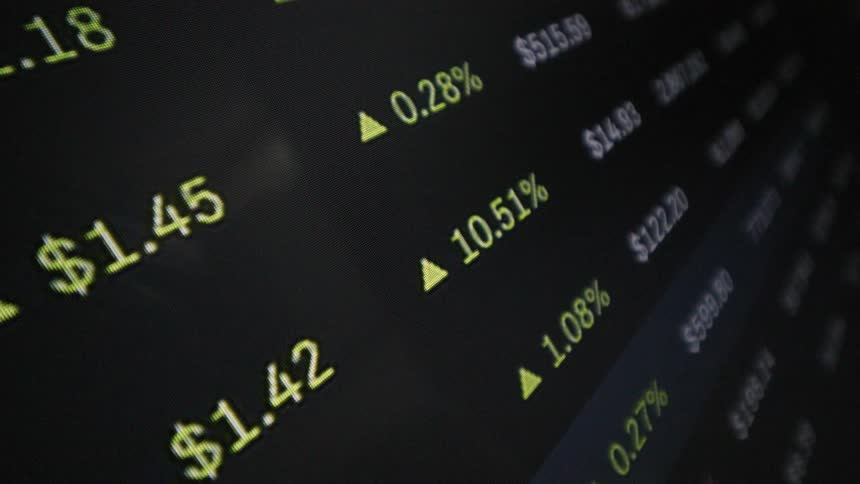
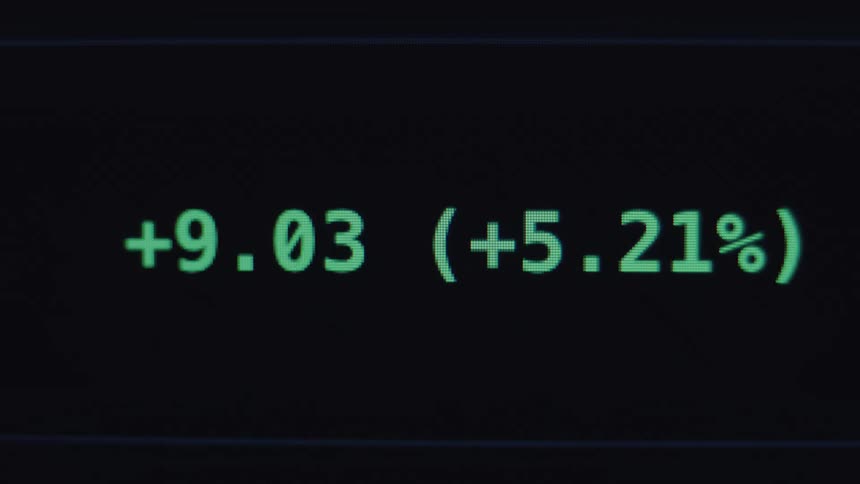
Close-up of a digital stock market ticker shows positive growth with green numbers fluctuating on a dark screen
A man watches two monitor displays in front of him
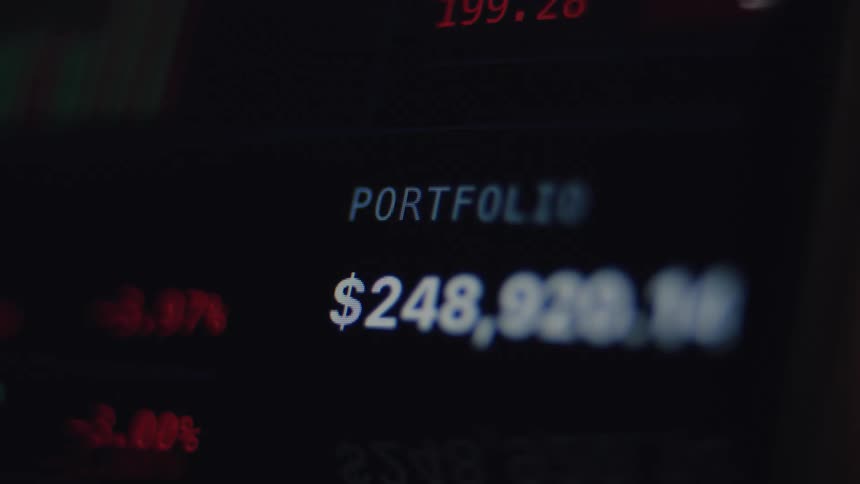
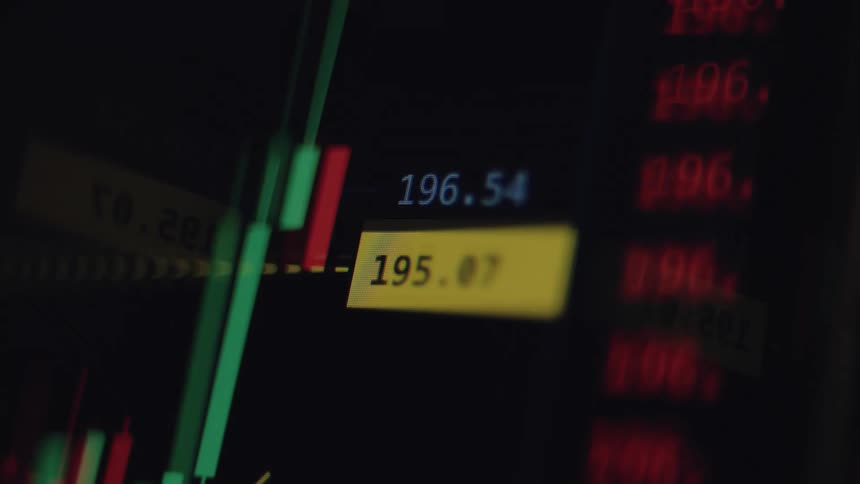
Close-up of a digital stock market screen displaying a portfolio's value with fluctuating red and green numbers
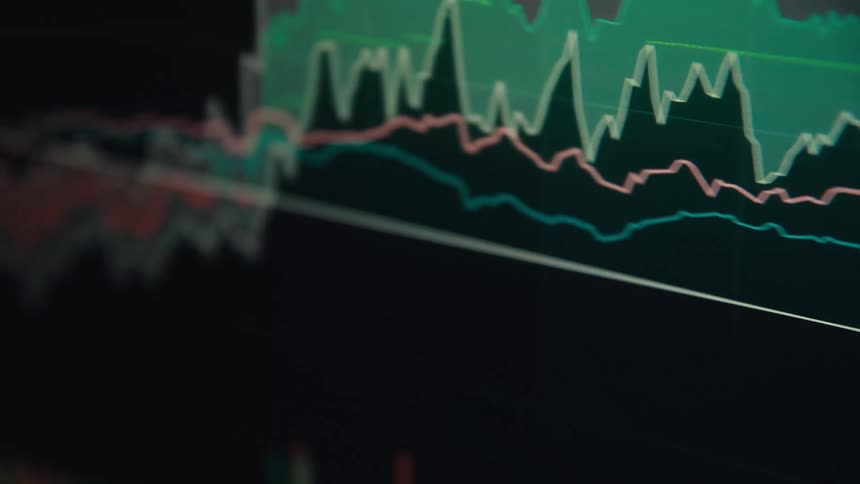
A closeup shot shows a digital screen displaying a financial graph with jagged lines fluctuating up and down in a rapid unpredictable pattern the camera pans along the digital chart showcasing the dynamic and complex movements of the data00
Red and green candlestick chart on a pixelated screen with RGB pixels as the bearish graph breaks resistance to the downside and the market or asset value collapses causing massive losses and volatility due to an unexpected crash
A digital chart with a downward-pointing arrow slowly pans across a screen, symbolizing economic decline
The person types bitcoin into the cell phone search engine
Multiple rows of graphs and numbers quickly scroll by on a screen
Dynamic hand-held macro shot of pixelated screen showing stock trading chart or financial graph crashing with negative downward tendency falling into the red figures causing stress and panic with fear of economic recession
Extreme close-up of a digital stock market display showing volatile price fluctuations in real-time
A large metallic gold dollar sign spins reflecting colors against a dark blue background
Stock related data is scrolled over on a screen
Hand holding a smartphone displaying a financial chart on a lit screen
Red and blue US dollar sign flashing on the screen with white background representing the economic power of the financial sector of the United States of America and central bank and international success of the Wall Street stock exchange
A close-up of a digital candlestick chart on a screen shows financial data fluctuating in real-time
A screen shows a financial chart with lines and bars moving up and down
A line drawing trading candles on a monitor either red or green depending on the trade before breaking resistance to the upside while the stock or crypto currency goes on price discovery making a new All-Time High or ATH with upward trend
Pixelated macro close-up of a digital screen showing the user interface of an online trading platform or finance app or broker application displaying a candlestick chart or graph with green candles as the price increases and goes up with a positive trend
Closeup shot of multiple screens displaying realtime stock market data and charts
A yellow line spins around a blue digital Euro bill icon or symbol representing the European central bank and currency unit and economic community on a pixelated smartphone screen with glitches
A graph on a screen with a black background and the graph has red and green ripples going up and down
A pile of cash is on fire
A cinematic, out-of-focus macro shot of a real-time stock market candlestick chart on a digital screen

Need help finding the
right footage?

Have it delivered to your account within 1 business day.

This is Filmsupply

Our StoryOur FilmmakersArticlesFilmsPopular SearchesAll Categories

FM

A family of brands dedicated to empowering the creative.

FILMSUPPLY

Footage licensing for productions

MUSICBED

Music licensing for filmmakers

STILLS

Image licensing for creatives

© 2026 FM LLC.

Privacy PolicyLicense TermsTerms & ConditionsCareers