Musicbed
Filmsupply
Stills
Contact Us(800) 805-6802

Chart Pattern Stock Video Footage

Licenses 781 high quality Chart Pattern stock video clips in 4K, raw formats

Artists Designing In Blue Lit Room

David Herbst

Stock Market Charts And Graphs

Myles Shank

Binary Tech And Computers

Evolve

Scientists Studying Ocean

Sypher

Abstract Light Source

Amnesty Films

Trembling elderly woman holding and pointing at a board with charts and text on it indoors
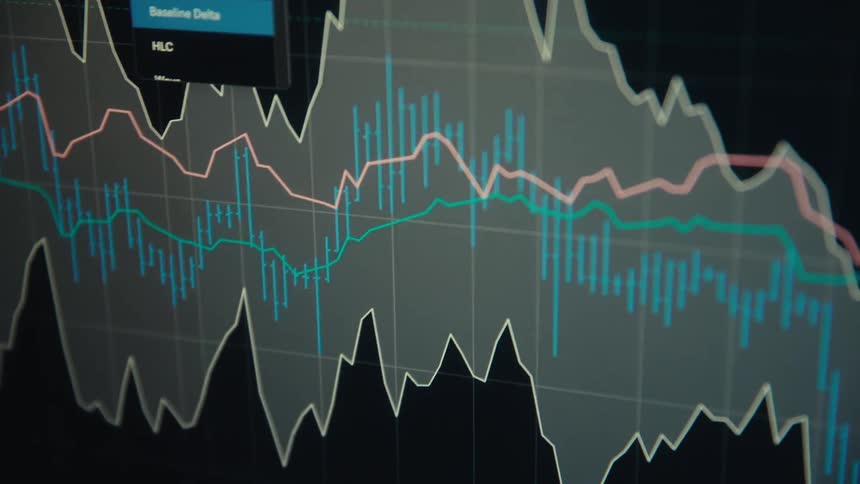
Close up of an electronic screen displaying a trading interface with blue candlesticks against a dark background
Digital candlestick chart displays rising financial market trends with animated technical analysis overlays
A stylized, out-of-focus close-up of a digital stock market chart showing fluctuating data with glowing lines
A bar and line graph shows an upward trend with an arrow emphasizing growth and increasing savings on the bank account for a solid retirement due to a successful pension plan and long-term investment strategy
Screen displays pink and green graph lines on a grid
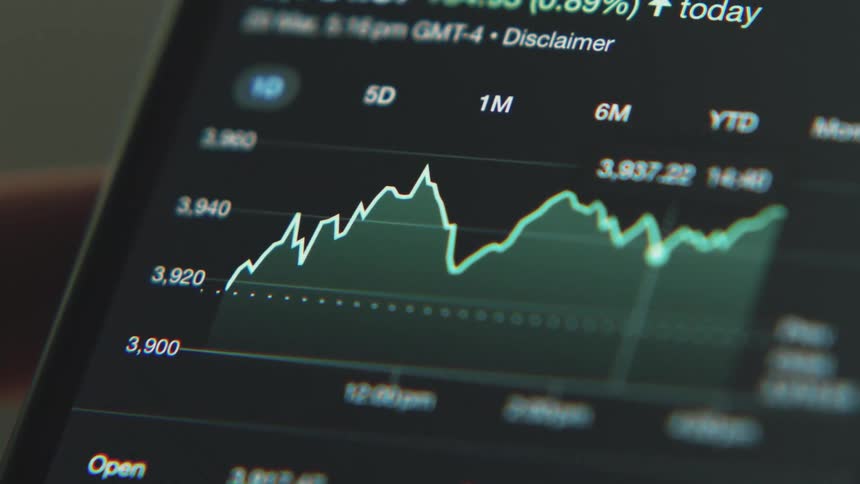
Graph and numbers moving on the screen of a smart phone
Closeup of a screen displaying a financial market graph
A woman sits at a desk in an office and works on her laptop
A person scrolls through stock market data on their phone
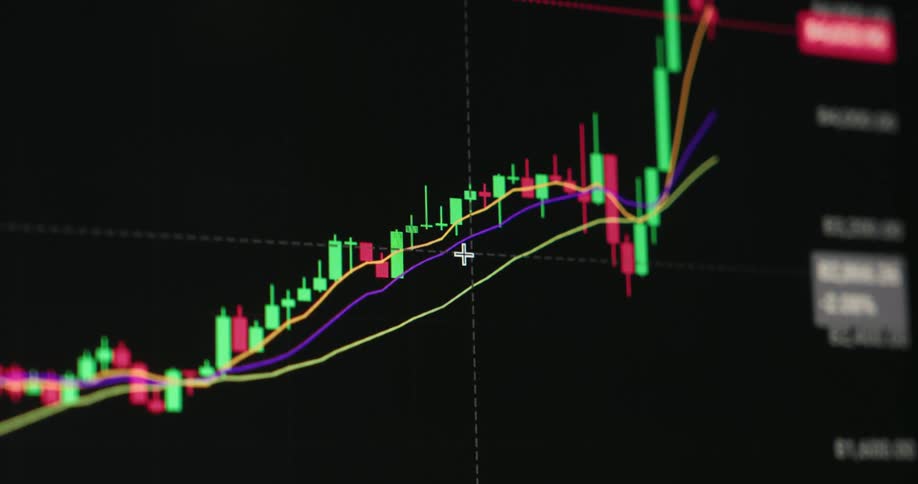
A monitor displays a stock market candlestick chart with green and red candles moving across a dark grid
Financial market candlestick chart against a dark background
A high-tech digital animation shows a fluctuating green line graph on a stock market or cryptocurrency exchange chart with data analysis overlays
An abstract, out-of-focus animation shows a volatile candlestick chart with red and green bars moving on a digital grid

Binary Tech And Computers

Evolve

A candlestick chart showing a stock price rising with green candles indicating upward movement while the Dow Jones or MSCI World ETF increases in value and price symbolizing a strong US economy and healthy global financial markets
A phone floats in a colorful ring
A close-up macro view of a financial candlestick chart with red and green bars fluctuating on a digital screen
Gold plated bitcoins on a reflective surface with a computer screen displaying a climbing graph
A chart is moving on the screen
Person selects time intervals and points on graph on phone display
Two individuals are reviewing financial charts printed on a black surface at home
Colorful candlestick chart against a background
A close-up of a dynamic digital stock market chart shows the fluctuating value of an asset over time with technical data analysis

Scientists Studying Ocean

Sypher

Abstract Light Source

Amnesty Films
A blurry, abstract animation of a candlestick chart showing stock market or cryptocurrency volatility on a digital screen
Futuristic closeup of a computer screen displaying a stock market graph or candle chart with ups and downs and upward tendency representing the digital and modern finance sector
A real-time digital trading chart fluctuates on a screen, with the line graph indicating financial gains and losses
A detailed, close-up view of a live financial candlestick chart showing market volatility with moving green and red bars
A man is using a stylus on his tablet
An elderly woman holds a pamphlet while sitting behind a camera giving an interview and sharing her views
Screen displaying the financial market chart in candles
A colorful, stylized animation of a financial candlestick chart displays market volatility on a digital grid
A computer monitor displays a candlestick chart of a stock price with the graph actively scrolling to the right
Cursor moves along the graph line on the screen
A close-up, shallow depth of field shot of a colorful candlestick graph displaying fluctuating financial market data on a screen
A financial graph with an upward trend arrow and bar chart rises on a digital screen, with smoke effects adding a mysterious atmosphere
Lines on a graph on a screen are moving
A digital stock market chart shows a bullish breakout with a green notification indicating a significant price increase
Some lines of a trading chart with green and red lines and the green line is going up
A computer screen displaying a stock market candlestick chart with fluctuating red and green lines indicating market trends
Digital display shows graph and data points
Green and orange colors of a candlestick chart contrast with the black background on a computer display
Close up of a blurry device screen displaying a trading interface in green over a dark background
A chart moves around on the computer screen
A close-up of a computer screen displaying a real-time candlestick chart for online stock, crypto, and forex trading
Candlestick chart of ETF or exchange-traded fund with steady growth and positive price performance over a long time span or years as the price of the asset steadily increases with an uptrend and successful value development symbolizing good investment
Finger points to a highlighted point on a line chart showing value variation
A macro close-up of a green 'Breakout' notification with an upward arrow appearing on a digital stock market or cryptocurrency trading chart
Small stack of gold bitcoins on a counter against green lights background
A line graph moves left to right on a laptop screen
A close up of a cell phone screen with a graph displayed and numbers
A healthcare professional uses a pen to point out details on a patient chart while explaining it to an elderly man likely during a home visit
Reflection on a screen partially obscures a candlestick chart
Futuristic digital display shows a dynamic candlestick chart of stock market or cryptocurrency trading with algorithmic analysis
An abstract, out-of-focus close-up of a live cryptocurrency or stock market candlestick chart with flickering red and green bars on a dark screen
Multiple data points at different values are continuously plotted next to a candle chart of a stock or crypto currency trading graph in a finance application or app on a dark pixelated computer screen
A digital graph on a screen shows a volatile stock price or cryptocurrency value fluctuating up and down, indicating gains and losses
An out-of-focus close-up of a live stock market or cryptocurrency candlestick chart showing real-time price fluctuations
A stock price chart is displayed on a computer screen
Closeup of a digital trading graph with fluctuating lines and bars on a screen
Multiple lines and a candlestick chart occupy the same graph on a digital screen as a selection is made
Overlapping line and candlestick charts display intense financial fluctuations
An angled closeup shot captures the dramatic peaks and valleys of a digital financial analytics chart with glowing yellow and green lines
A financial chart with red and green bars and colored lines is displayed on a dark screen

Need help finding the
right footage?

Have it delivered to your account within 1 business day.

This is Filmsupply

Our StoryOur FilmmakersArticlesFilmsPopular SearchesAll Categories

FM

A family of brands dedicated to empowering the creative.

FILMSUPPLY

Footage licensing for productions

MUSICBED

Music licensing for filmmakers

STILLS

Image licensing for creatives

© 2026 FM LLC.

Privacy PolicyLicense TermsTerms & ConditionsCareers