Musicbed
Filmsupply
Stills
Contact Us(800) 805-6802
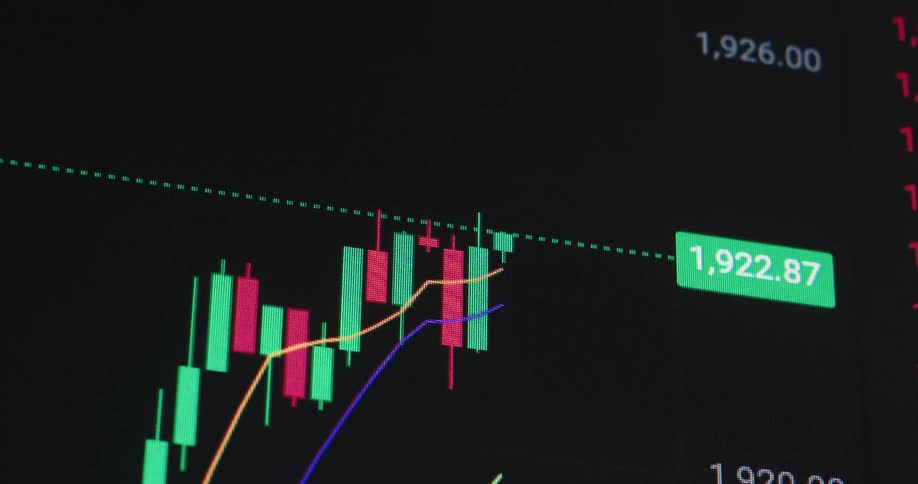
Trend line drawing red or green trading candles on monitor creating a candle stick chart pattern with upward tendency and great price development showing a successful trade with good performance and profit on black screen with grid
Black and white animation of bar chart of stock prices or business development features an upward arrow moving from left to right with a positive trend line and a rising value as part of financial data statistic during cooperate presentation
Screen with ema ribbon indicator and graphics
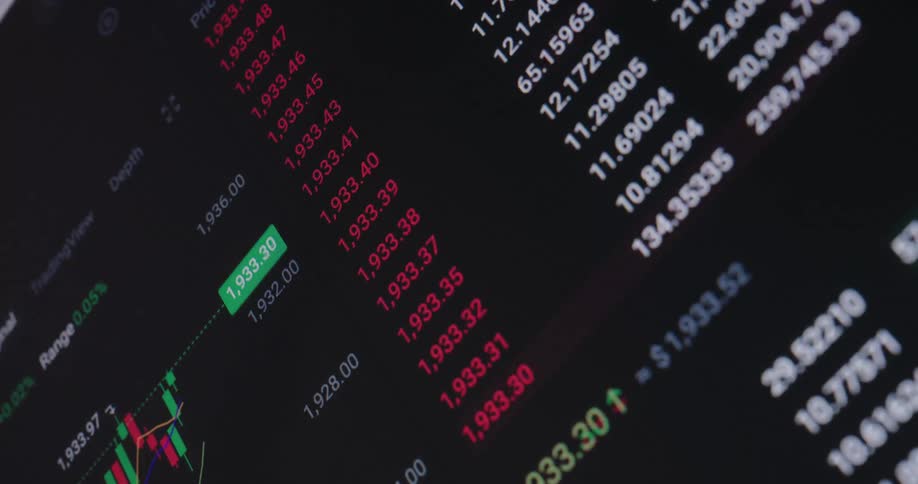
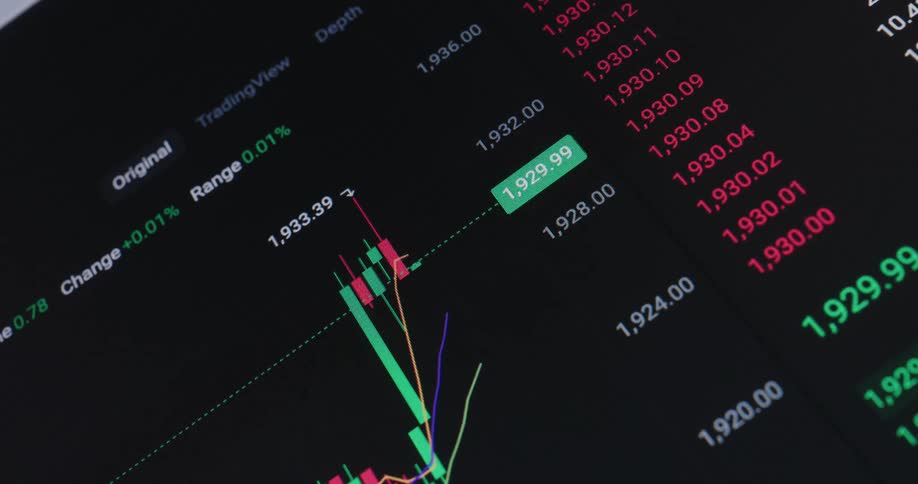
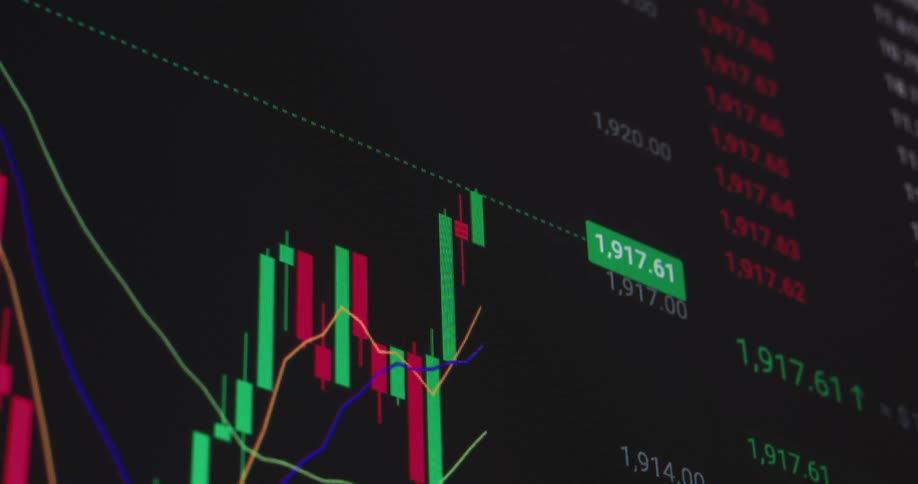
Handheld macro close-up of bullish financial market chart or candlestick trading graph on black screen displaying the UI of stock or crypto broker application or platform as the price surges and the value of the asset increases during investment bull run
Close up view of a person looking at their phone
Soft focus close up of a digital stock market candlestick chart displaying volatile price movements
Vibrant blue and orange neon lines move across a dark digital screen with a grid pattern and soft light leaks creating a modern and tech focused background
A person uses their tablet to check stocks
Close up of a blurry device screen displaying a trading interface in green over a dark background
Stock data is plotted in red and green against a black background on a screen
The graphs change on the computer display
Close up of a felt marker drawing a line on paper
Two people point at the plot displayed on a laptop while collaborating
Multiple colorful lines move in an animated digital graph
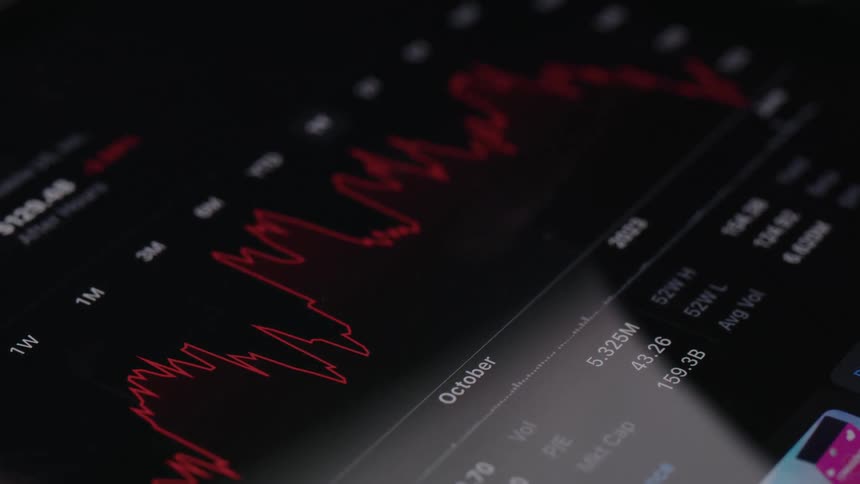
Extreme closeup of a pixelated red chart with significant downward trend highlighted by descending line and arrow as the stock market or the global economy decline and the US dollar loses value due to negative price development
A close view shows blurry digital graphs and stock market data with red and green bars moving quickly across a dark screen
Computer screen shows financial candlestick trading chart consisting of glowing neon green and red candles with wicks as prices goes up with positive trend and little volatility while the stock asset or ETF increases in value over time as good investment
A close up clip of a trading chart
A persons arm touches a display showing stock prices then jots down something on a piece of paper
A needle slides along a white rounded sheet
A chart moves around on the computer screen
Retro computer monitor or screen displaying a neon green growing graph of a vintage broker or trading software enabling users to buy and sell stocks online in order to make profit and earn money and invest for their future
An animated digital line graph shows a volatile stock price rising and falling, changing color from green to red to signify losses
Looking at a pixelated computer screen or monitor displaying a trading interface of an online platform as the bullflag pattern breaks out and the long green candles move rapidly to the upside causing gains and profits with shaky camera movement
Moving capture of a map
A close view focuses first on a hand analyzing a printed chart with a stylus then shifts to a laptop screen displaying a digital financial dashboard
Close up of a device screen displaying a trading interface in green over a dark background
A fluctuating line graph appears on a digital screen with distinct peaks and troughs
A real-time digital trading chart fluctuates on a screen, with the line graph indicating financial gains and losses
A stylus pointing at a glowing financial chart on a dark digital screen emphasizing data analysis and market trends
Pixelated screen of a vintage 90s computer displaying a green graph with an arrow pointing upwards symbolizing the beginning of the digital financial era and the first online trading platforms for buying stocks in the internet
Bullish and bearish financial market candle chart
A person draws with a sharpie
A clip of a screen displaying a digital trading candlesticks
A screen where there is a trading chart with red and green lines that are going up and down and there are numbers on the right side
The white sound wave bar animation jumps and moves up and down with the song while the music track or audio book is being recorded in a sound studio using vintage recording or hi-fi equipment with a pixel RGB screen
A close up of red and green lines on a graph
A closeup digital screen displays a fluctuating stock or financial chart
A close-up view of a user manipulating a colorful three-dimensional surface plot on a computer screen
A close-up, out-of-focus shot of a blue digital line graph fluctuating on a dark screen, representing stock market data or financial trends
A footage of a digital trading screen
An abstract, out-of-focus close-up of a live cryptocurrency or stock market candlestick chart with flickering red and green bars on a dark screen
The numbers move fast on the monitor
Numbers grow on the graph displayed
Looking up onto retro computer screen or monitor displaying a trading chart candlestick animation consisting of long green candles as the price increases and the broker or trader makes a successful trade with lots of profit and the stock reaches new ATH
A persons hand writing on a piece of paper with a blue marker
An extreme close-up of a computer screen showing an animated bar and line graph with upward trending data
A high-tech digital animation of a financial market graph showing fluctuating prices with data analysis tracking
A close-up of a digital stock market chart shows a line graph rising in blue before turning red and crashing downwards
Close-up macro of a financial bar graph on a digital screen with a white arrow pointing down, indicating a downward trend, recession, or stock market crash
Red falling trading chart of an online stock broker or crypto exchange in a downward trend during a bear market crash and financial crisis symbolizing failure bankruptcy insolvency and losses caused by declining international and global economy
The monitor is showing stock activity
A student is using a protractor and writing in a notebook
A blurry close-up of a digital financial graph shows a downward trend indicating a market crash or economic recession
A person's hand uses a stylus to analyze a colorful bar graph on a tablet screen
Large colorful map of north american continent hangs on wall
The camera captures an extreme closeup of a screen as a graph of a share index traded at Wall Street or on an online stock exchange app is plotted while going up and down or falling or rising and changing between positive green and negative red
A large computer monitor shows a graph with zigzag lines and numbers
A rapid blurry pan across a digital financial interface showcases glowing orange and teal bar graphs and fluctuating data lines that shift through heavy motion blur and vibrant light leaks
A digital stock market chart shows a bullish breakout with a green notification indicating a significant price increase
A map lays on this table
An extreme close-up shot follows a blue marker as it draws lines and diagrams on a reflective whiteboard
Close-up of a digital green financial bar graph on a computer screen showing a positive upward trend and growth

Need help finding the
right footage?

Have it delivered to your account within 1 business day.
This is Filmsupply

Our StoryOur FilmmakersArticlesFilmsPopular SearchesAll Categories

FM

A family of brands dedicated to empowering the creative.

FILMSUPPLY

Footage licensing for productions

MUSICBED

Music licensing for filmmakers

STILLS

Image licensing for creatives

© 2026 FM LLC.

Privacy PolicyLicense TermsTerms & ConditionsCareers