Musicbed
Filmsupply
Stills
Contact Us(800) 805-6802
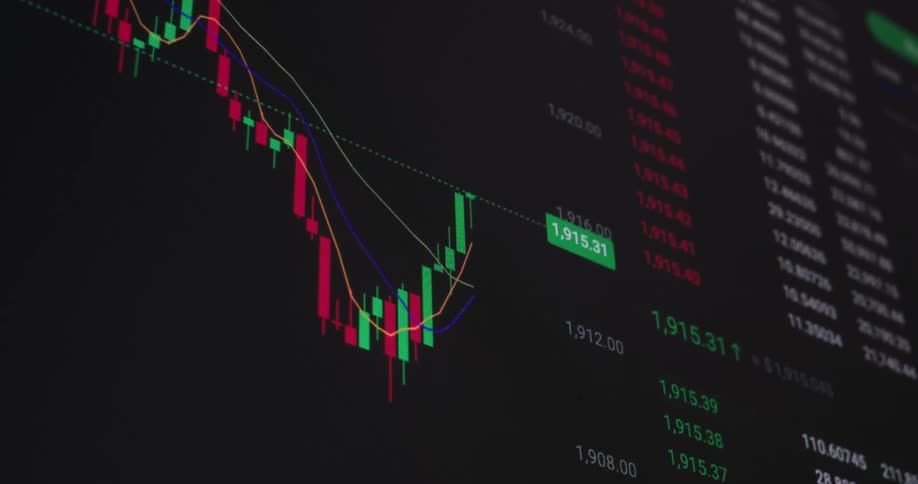
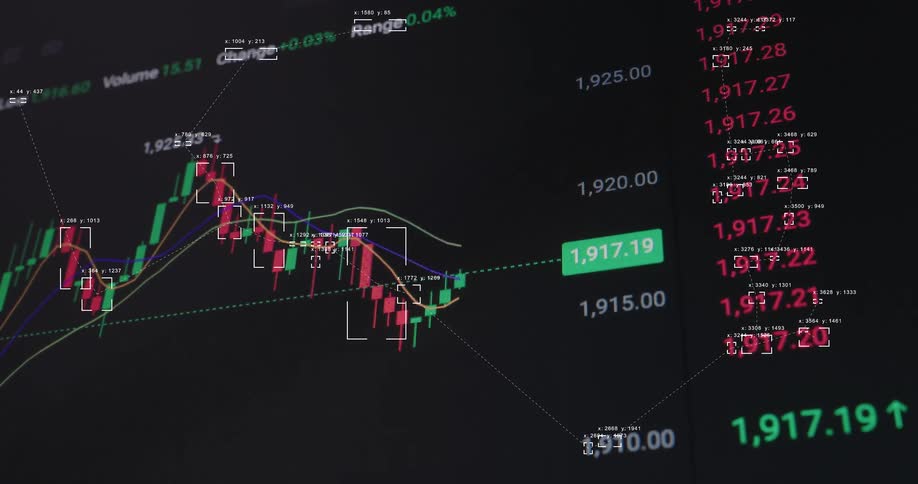
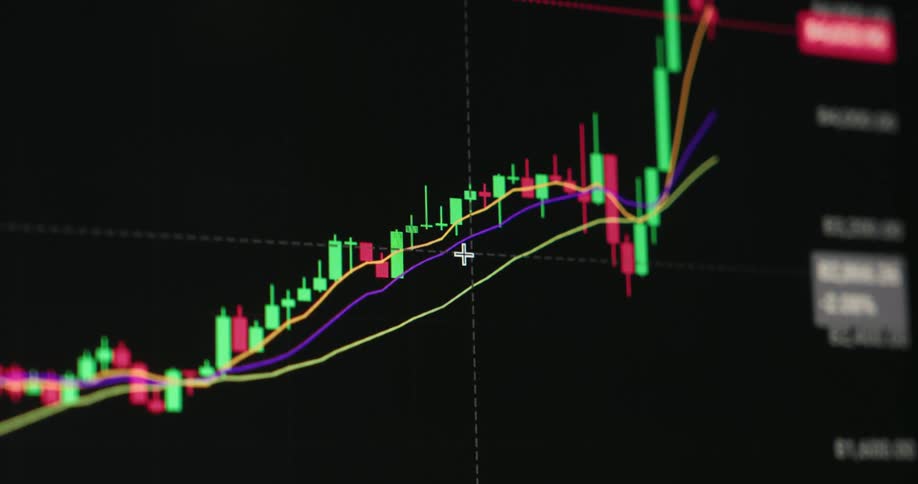
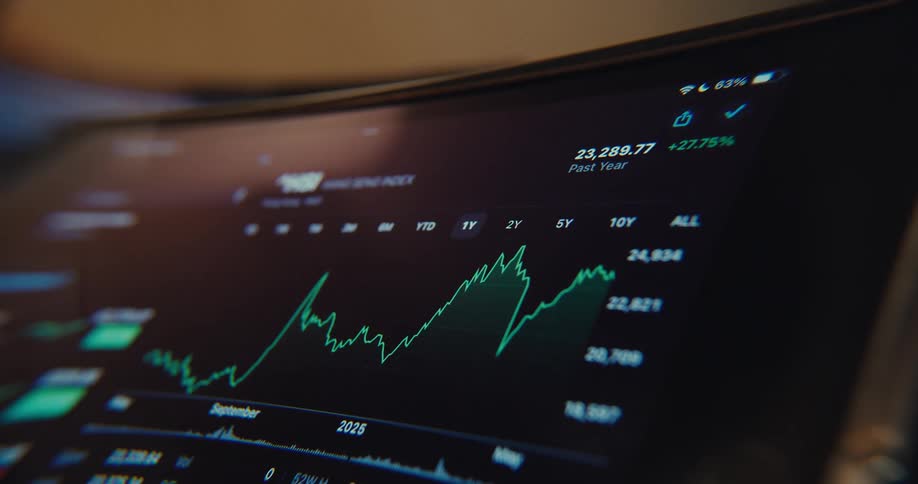
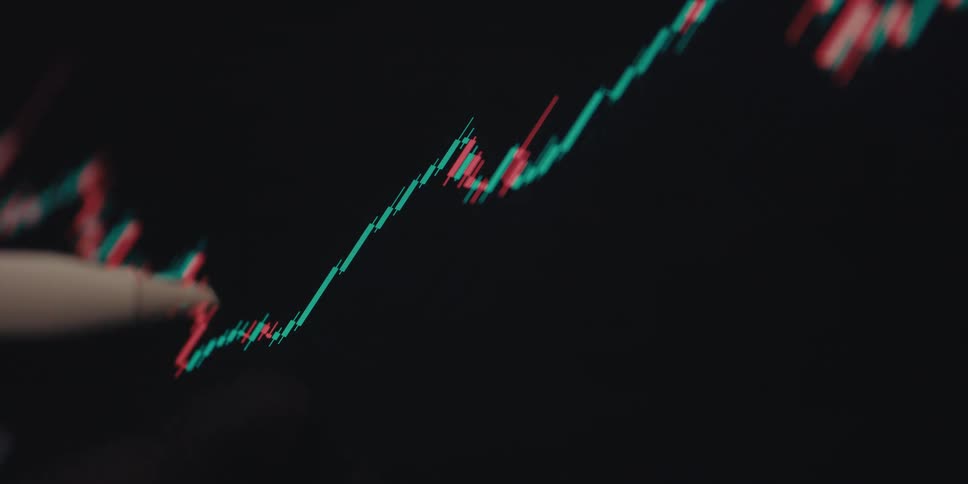
A computer screen displaying a stock market candlestick chart with fluctuating red and green lines indicating market trends
An animated green bar chart on a digital screen illustrates exponential growth with a rising arrow
A black screen with a trading chart with green and red lines going up and down
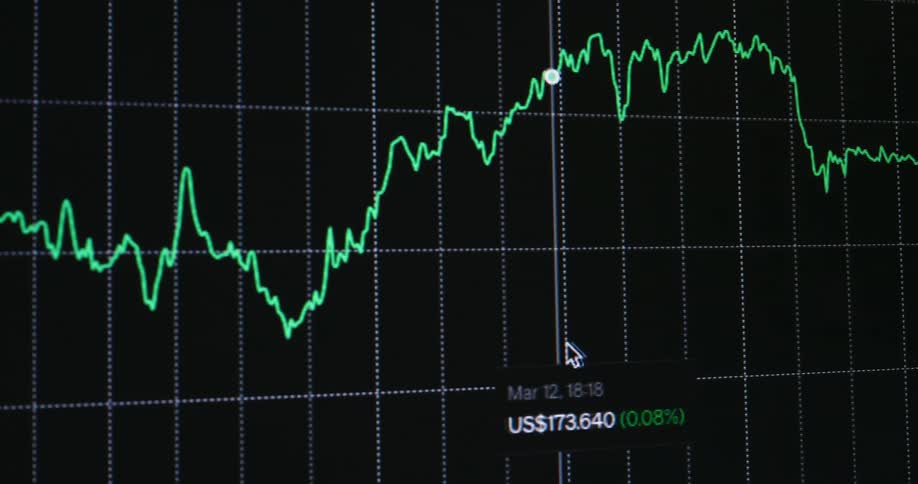
Green line displays digital information against a black background
Retro Macintosh computer screen displaying financial market chart of an online trading platform or broker application for buying stocks or shares with bright neon green candles as the price goes up or increases with a positive trend
A financial chart shows a volatile market trend with sharp rises and dips over time
A blurry stock line graph slopes downward against a blue background
A person uses a stylus to analyze a colorful bar graph on a tablet screen while working from home
The screen is full of line graphs
Finger pointing at a market line chart displayed on a digital screen
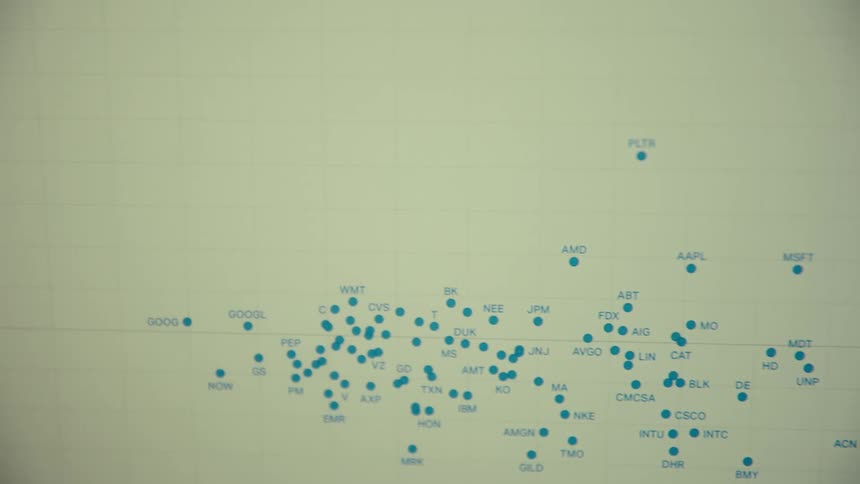
Plot displayed on a computer monitor contains labeled blue dots
Blue colors the area under the line in a graph contrasting with the black background on a computer screen
Green and orange colors of a candlestick chart contrast with the black background on a computer display
The numbers on the monitor change frequently
An animated bar graph on a digital screen shows a steady upward trend and exponential growth
Overlapping line and candlestick charts display intense financial fluctuations
A closeup shot of a screen displaying fluctuating stock market graphs and numerical data
Market chart displaying shaded areas and colored lines representing financial fluctuations
Reflection on a screen partially obscures a candlestick chart
A financial graph with an upward trend arrow and bar chart rises on a digital screen, with smoke effects adding a mysterious atmosphere
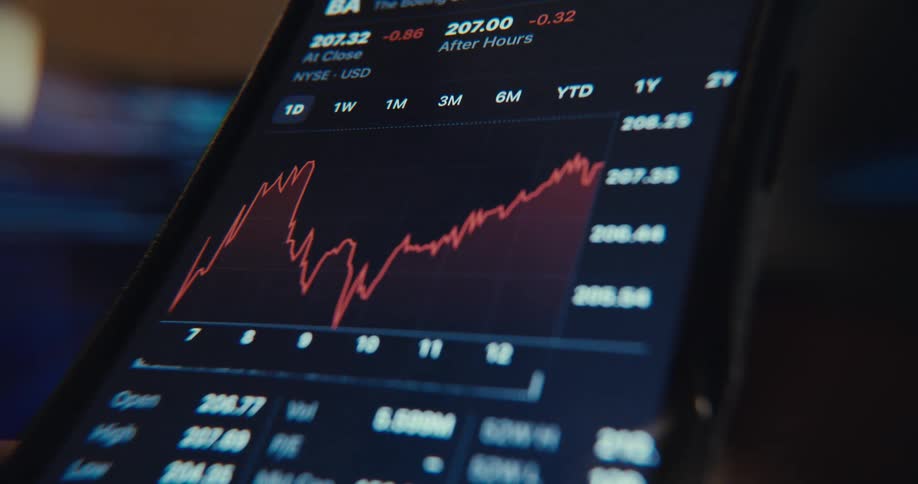
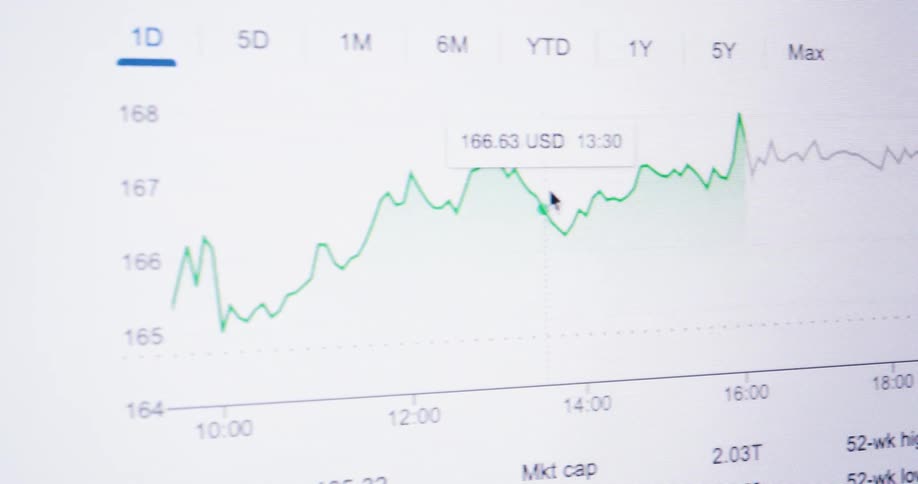
Closeup of a computer screen showing live stock market data and charts
A financial analyst's hand uses a stylus to interact with a colorful digital bar graph on a tablet, analyzing business performance statistics
A close up of numbers and charts on a screen
Futuristic digital display shows a dynamic candlestick chart of stock market or cryptocurrency trading with algorithmic analysis
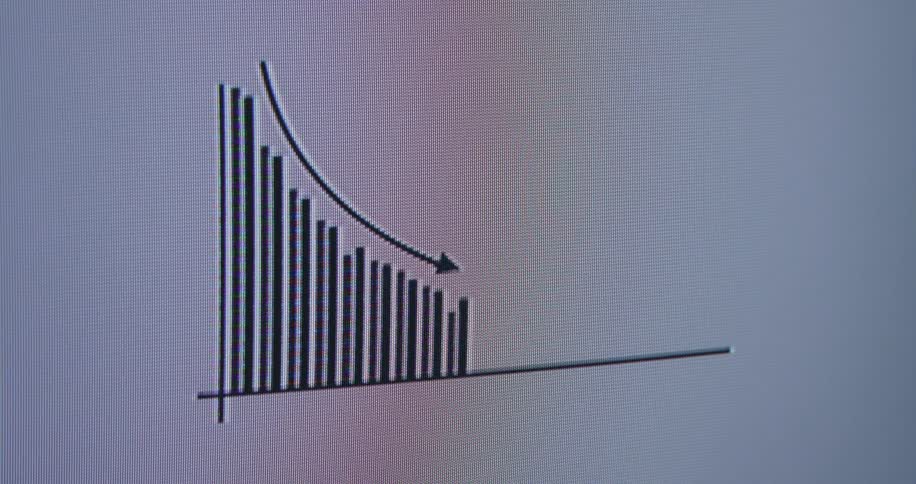
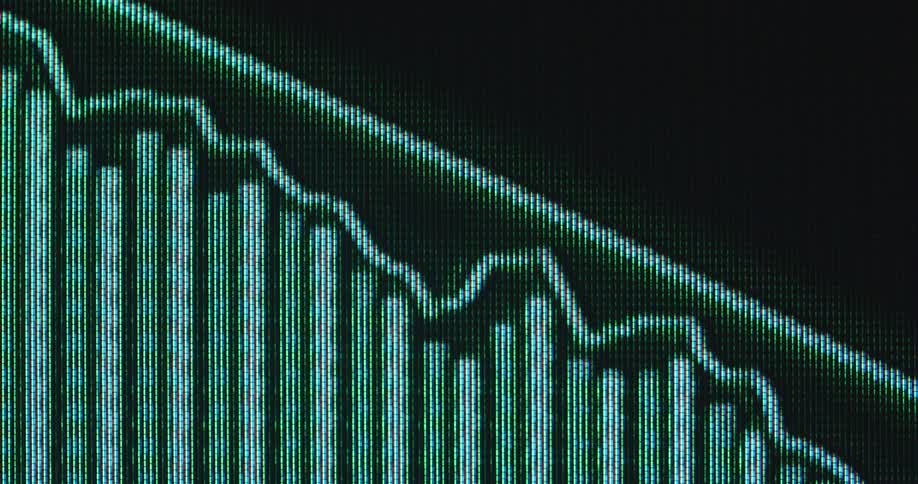
Extreme macro view of a digital screen with RGB pixels shows a black line graph with a downward pointing arrow overlaying vertical black bar charts representing a stock market crash or economic downturn with negative trend
Multiple lines and a candlestick chart occupy the same graph on a digital screen as a selection is made
Multiple data points at different values are continuously plotted next to a candle chart of a stock or crypto currency trading graph in a finance application or app on a dark pixelated computer screen
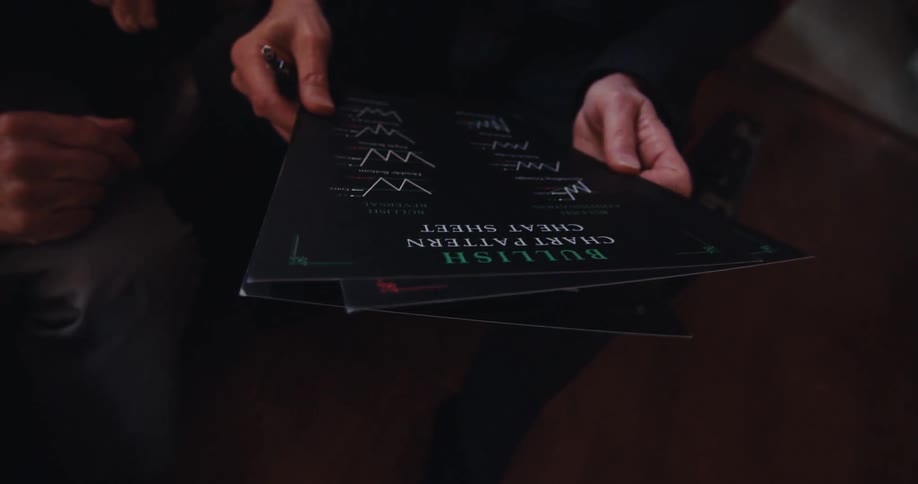
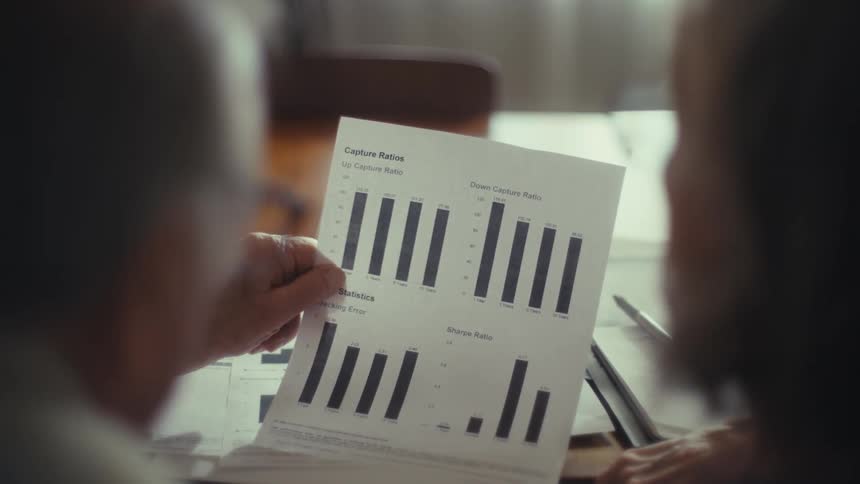
Two individuals are reviewing financial charts printed on a black surface at home
A computer monitor displays a stock market candlestick price chart
A retro animated bar graph on a vintage computer screen shows an upward trend of growth and success
A red and green line graph depicting a sharp decline is prominently displayed on a dark background suggesting a financial downturn and loss
Computer broker screen displaying a green rising graph animation or trading chart visualizing constantly increasing ETF or Exchange Traded Fund prices such as the MSCI World DAX Dow Jones or S&P 500
Closeup of a screen displaying a financial market graph
Cursor causing the screen to scroll to the right as it moves along the graph line
A bullish bull flag chart pattern is displayed on a dark monitor as the red and green candlestick candles form sideways consolidation before breaking resistance for a massive move to the upside with positive price development and profit in a bull run
Price variation chart with green and red lines showing financial values
A line on a graph moves up and down as it travels across a screen
An elderly couple looks through a document while sitting at the dining table at midday
A display showing charts of a stock price
A smartphone screen displays various stock market charts rapidly changing between green upward trend and red downward trend graphs for different companies and indices
A green graph on a monitor
Closeup of a monitor displaying a financial market chart
A monitor displays a stock market candlestick chart with green and red candles moving across a dark grid
A financial chart with red and green bars and colored lines is displayed on a dark screen
Close-up of an animated financial bar chart on a screen showing a downward trend
A screen shows a financial chart with lines and bars moving up and down
A stylus switches between different time frames for a stock market chart on a tablet screen
Numbers and a line chart are on the computer monitor
Person scrolls through stock information on a tablet
A simple animated bar and line graph illustrates positive growth and increasing profits on a black digital screen
Informational graphs cover the computer screen
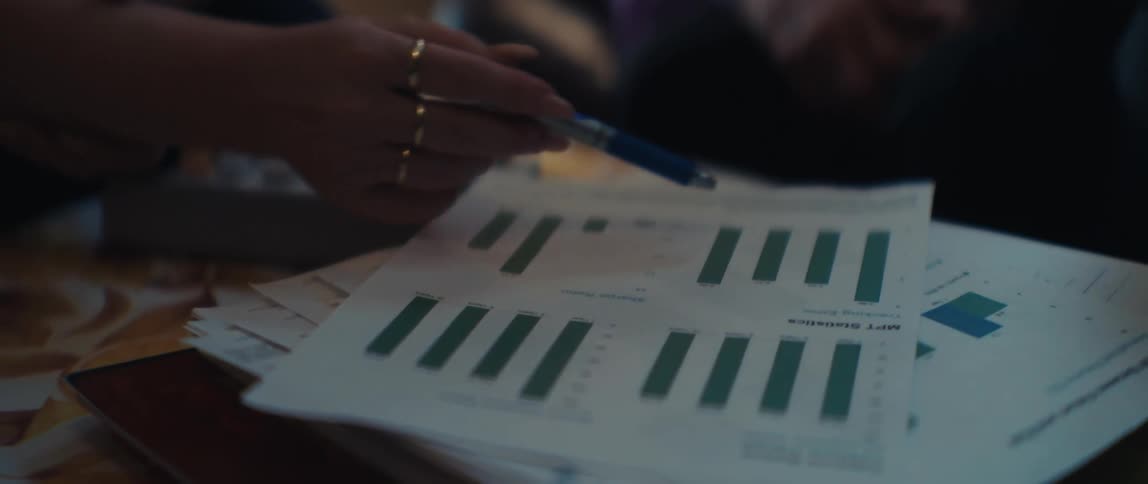
Financial advisors review and analyze printed bar chart data on MPT statistics during a business meeting
A digital screen showing stock market price chart
Mouse scrolling over a graph of the value of a currency
A business professional analyzes a colorful bar chart of monthly data on a tablet using a digital pen
Candlestick and line charts display variations on a financial panel
Closeup shot of multiple screens displaying realtime stock market data and charts
A person scrolls through colorful bar graphs showing monthly business data on a digital tablet screen
Futuristic macro close up of a retro digital CTR screen playing animated graph with a rising line chart and upward pointing arrow overlaying moving black bars representing stock market or business growth with financial success on white background
Wide angle shot of a pc screen that displays a red chart with an arrow rising from left to right while prices increase and the inflation rate keeps going up while the economy is fearing a recession as the fiat money system collapses
A stylus pen resting against a computer screen displaying a stock market chart with red and green lines
The neon green graph forms an old 90s computer screen showing a vintage user interface of a stock trading platform or exchange as the commodity and equity prices crash and a global recession hits the finance markets
A graph on a screen with a black background and the graph has red and green ripples going up and down

Need help finding the
right footage?

Have it delivered to your account within 1 business day.
This is Filmsupply

Our StoryOur FilmmakersArticlesFilmsPopular SearchesAll Categories

FM

A family of brands dedicated to empowering the creative.

FILMSUPPLY

Footage licensing for productions

MUSICBED

Music licensing for filmmakers

STILLS

Image licensing for creatives

© 2026 FM LLC.

Privacy PolicyLicense TermsTerms & ConditionsCareers