Musicbed
Filmsupply
Stills
Contact Us(800) 805-6802
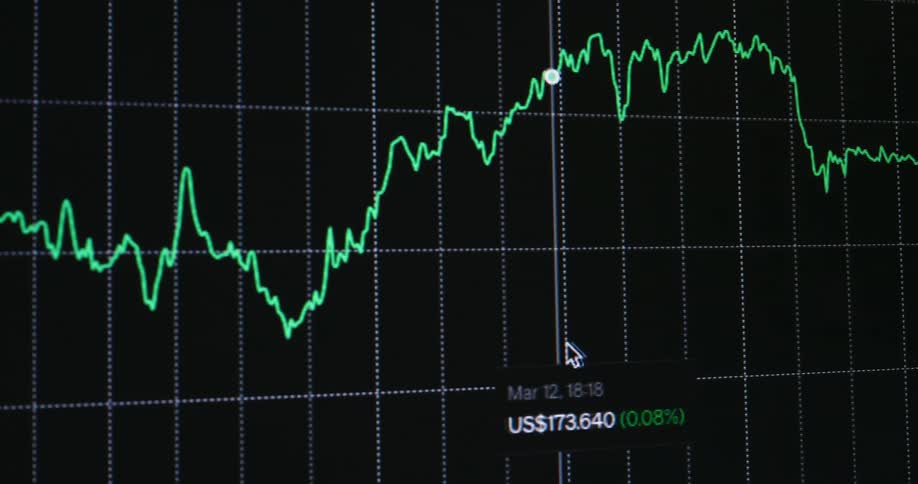
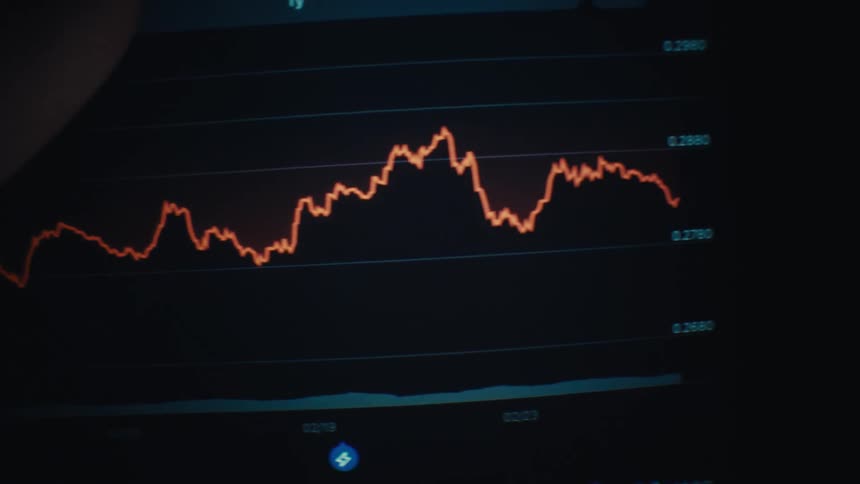
Price chart of a stock displayed on a screen
The animated trading graph or candlestick chart is moving on the computer display as a recession hits the global finance markets and the prices crash as red candles symbolize the end of a market cycle and the beginning of a financial crisis or depression
An animated candlestick chart on a digital screen displays fluctuating stock market or cryptocurrency data and analytics
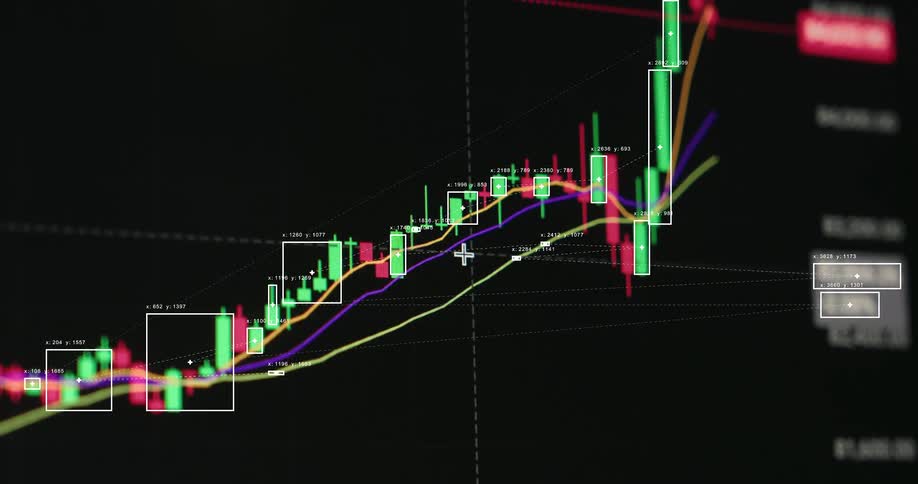
Looking up onto retro computer screen or monitor displaying a trading chart candlestick animation consisting of long green candles as the price increases and the broker or trader makes a successful trade with lots of profit and the stock reaches new ATH
Bundles of banded bills are on fire
A pile of cash is on fire
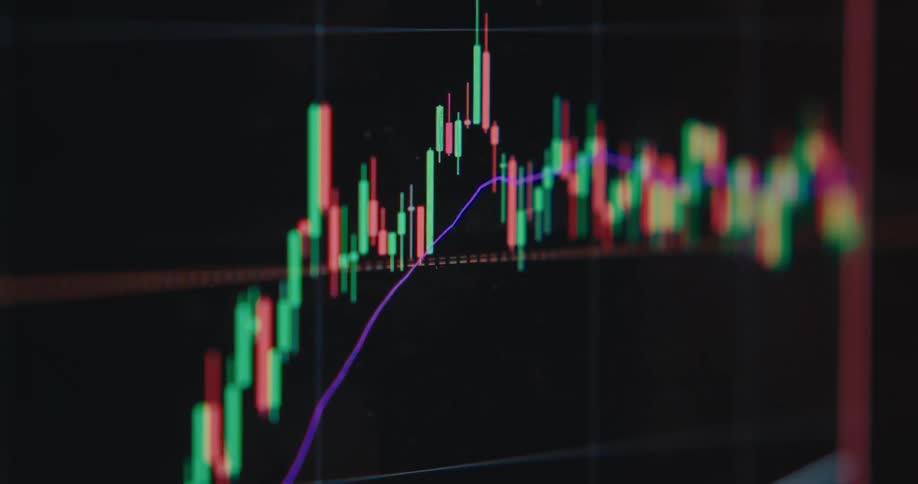
A monitor displays a stock market candlestick chart with green and red candles moving across a dark grid
Man sits at desk with several monitors in the dark
A red and green line graph depicting a sharp decline is prominently displayed on a dark background suggesting a financial downturn and loss
Digital candlestick chart displays rising financial market trends with animated technical analysis overlays
Colorful candlestick chart against a background
A close-up of a computer screen displaying a real-time candlestick chart for online stock, crypto, and forex trading
A line graph is displayed on the monitor
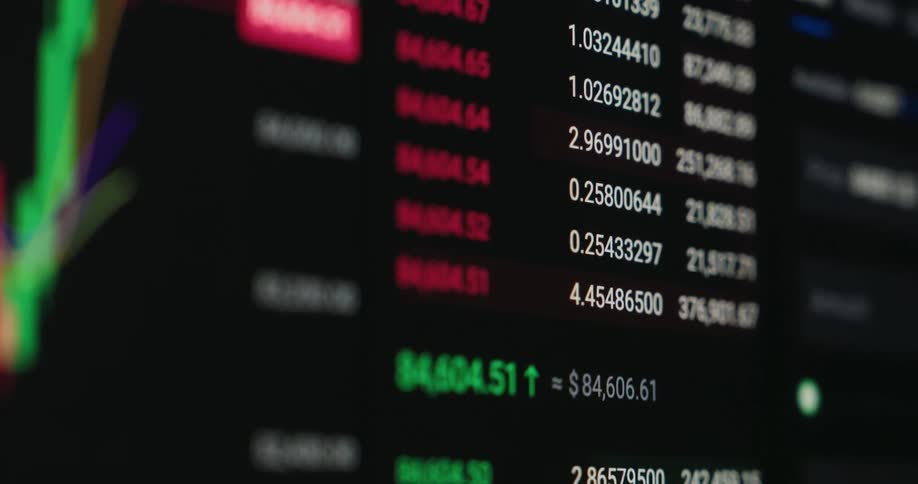
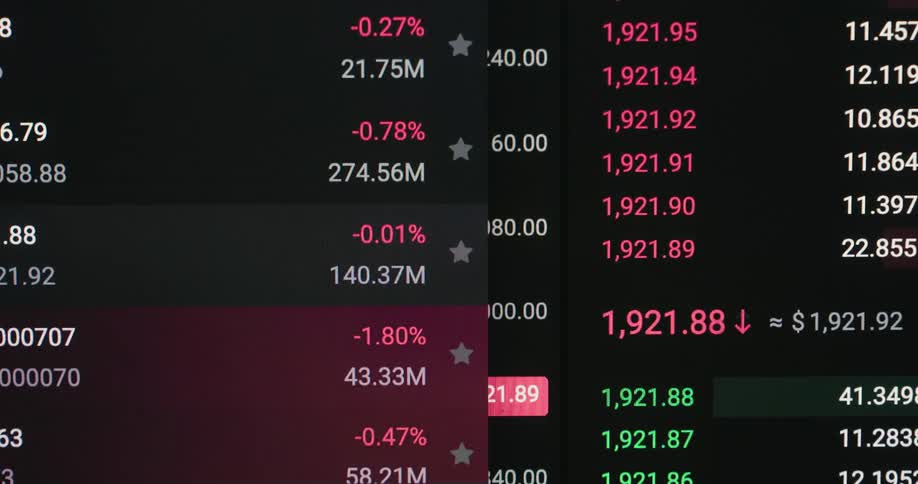
Numbers representing stock information change on the screen
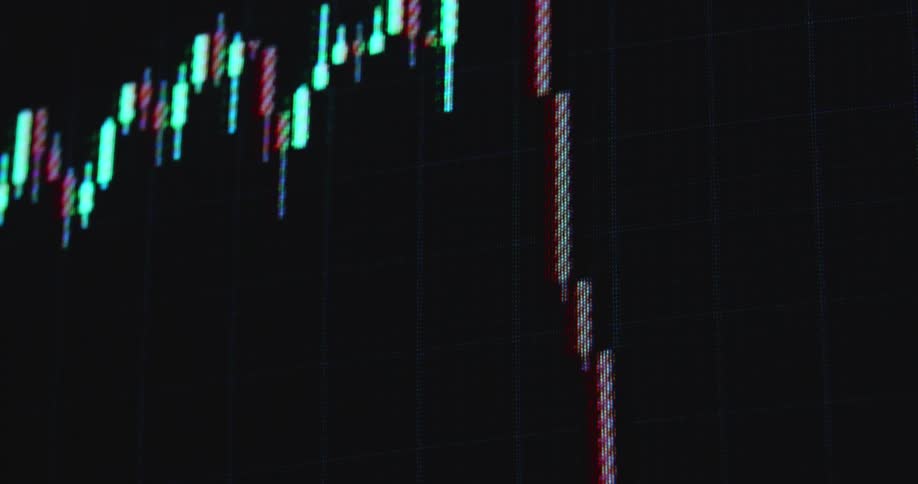
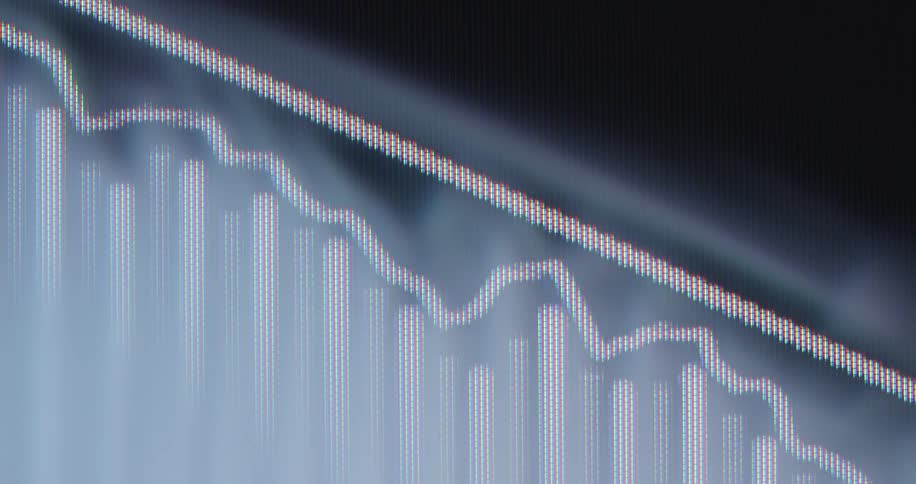
The financial markets are crashing due to a recession making stocks and shares drop and go down in price with decreasing value symbolized by a falling candlestick chart with red candles on a RGB pixel screen with black background
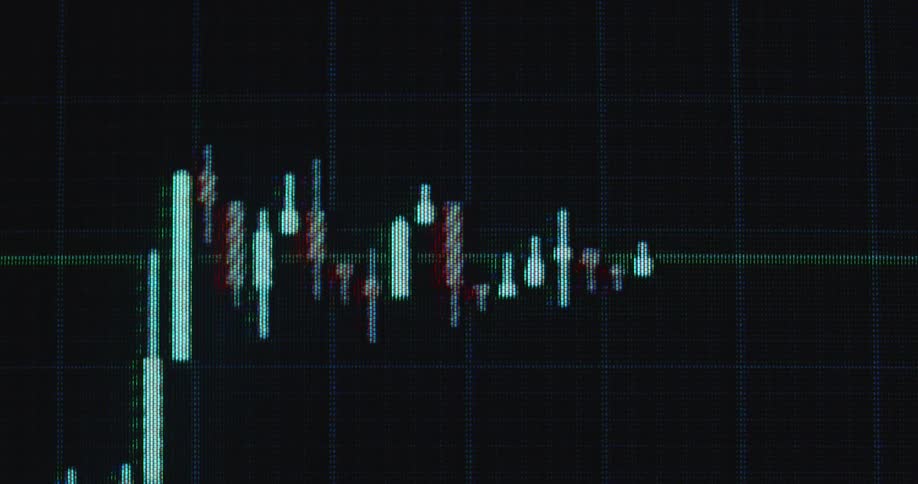
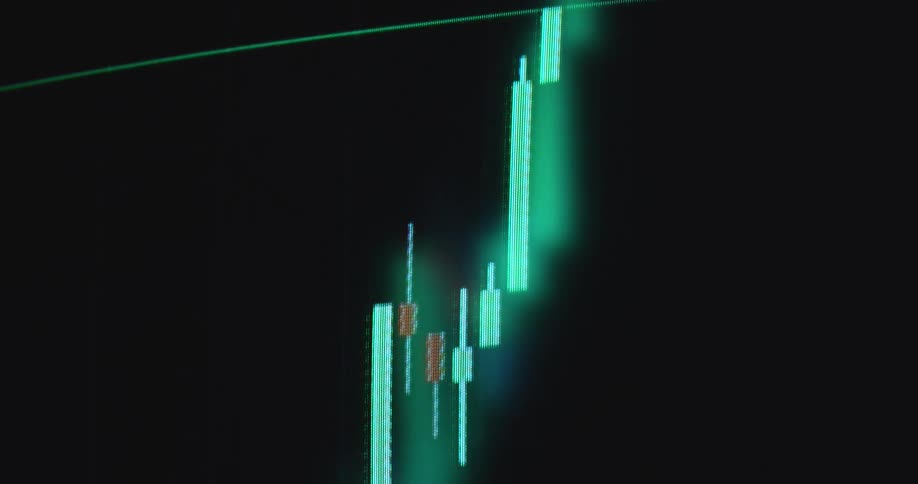
Pixelated candlestick chart on a screen or monitor panel forming a bullish flag pattern while the trading chart analysis shows that the graph is about to break resistance to the upside making the price of the stock or asset go up and increase in value
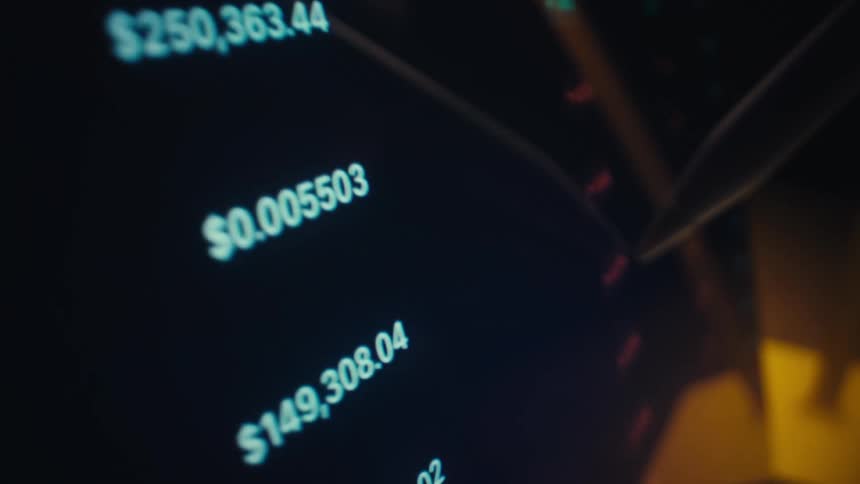
Digital pen pointing to numeric values displayed on a dark financial interface
Extreme close-up of a declining financial chart on a digital screen with a downward-pointing arrow indicating a market recession
Coins falling is displayed
The pixelated computer screen shows the financial market reacting to a black swan event such as 9/11 causing a global economic crisis and crash followed by recession and great depression as the stock market collapses
Dynamic macro close up of gold penny being collected in neon piggy bank money box icon on vintage TV screen symbolizing putting money aside by buying an ETF stock portfolio or saving on a bank account for profitable interest rates
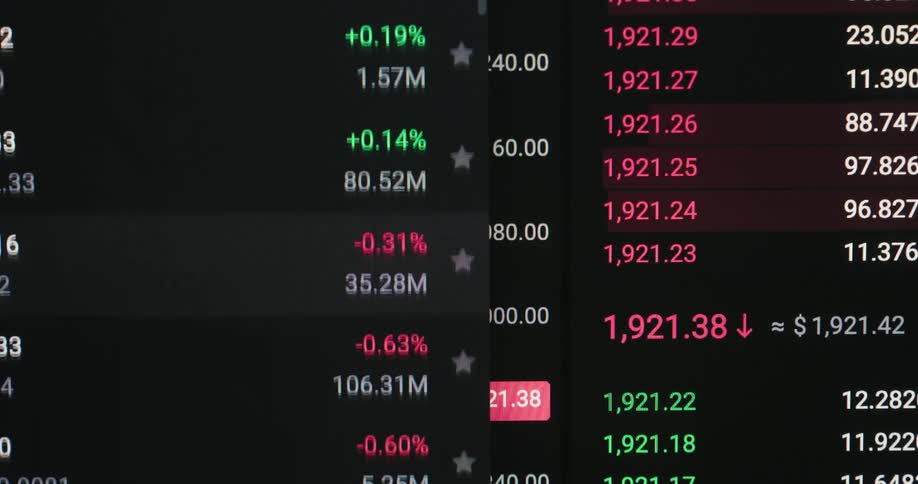
The screen has numbers and percentages displayed in a list
Monetary values on digital screen with reflection of person
Coins flying up in the air fall back down
A person is working on the laptop in the office
Cursor causing the screen to scroll to the right as it moves along the graph line
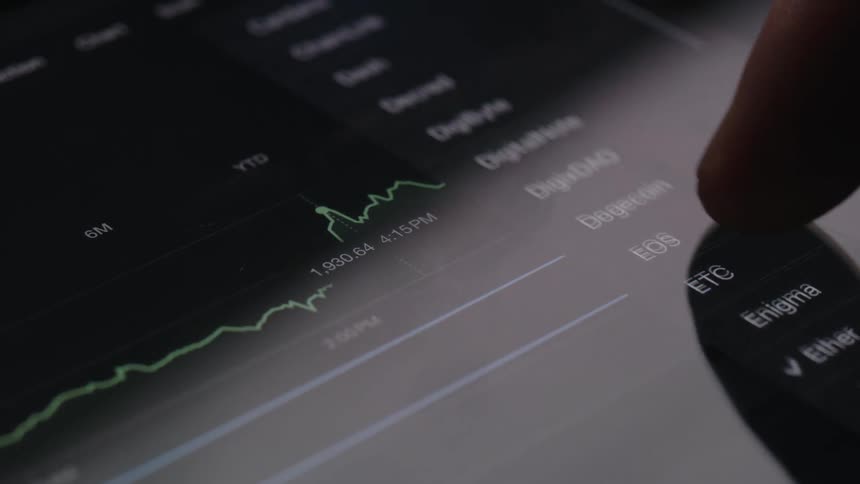
A finger scrolling through screens
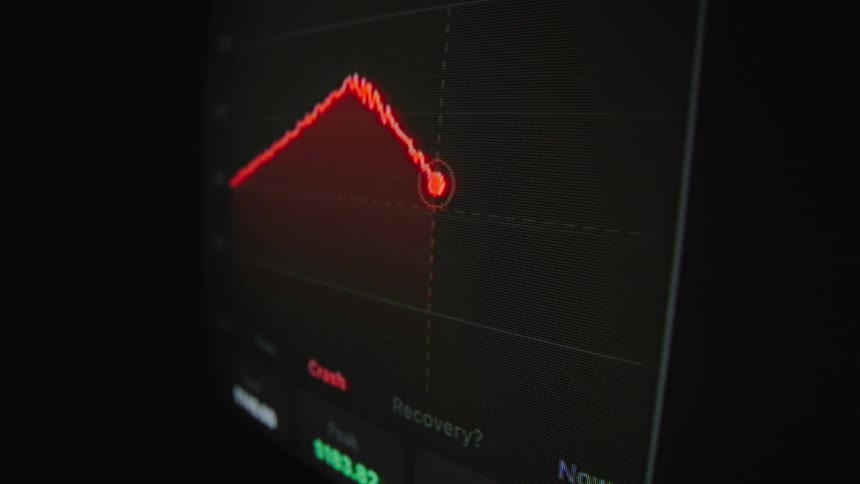
Close-up on a digital stock market chart showing a sudden and dramatic price crash after reaching its peak
An animated red bar graph with a downward pointing arrow trends down, symbolizing economic recession
A financial analyst compares data from a printed report with a live stock market chart on a laptop screen
An up close of a computer screen as a person uses their finger to scroll
Close up view of a person scrolling on their phone
Numbers flash on the screen fast
Closeup of a newtons cradle with polished metal balls in motion in a dark studio
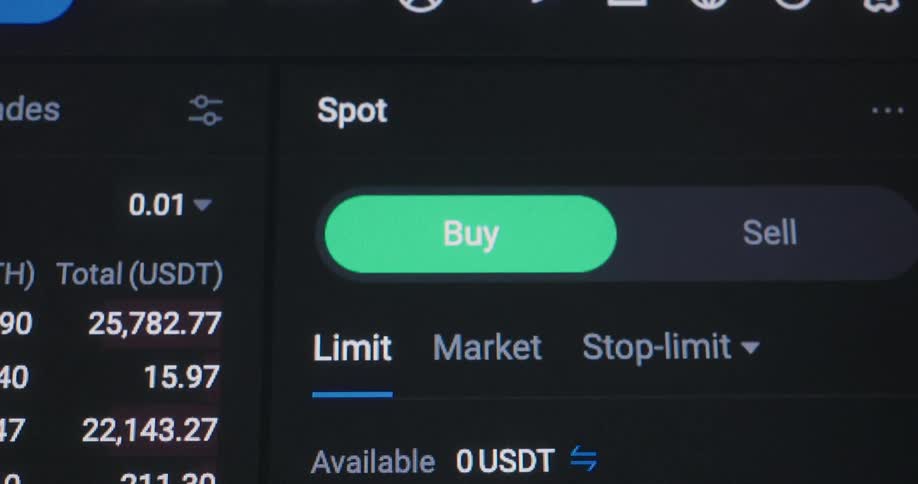
Tables and charts next to transaction buttons for the stock market
A rocket launches into space
Retro Macintosh computer screen displaying financial market chart of an online trading platform or broker application for buying stocks or shares with bright neon green candles as the price goes up or increases with a positive trend
A chart is moving on the screen
Closeup of a graph of financial data that occasionally shows spots of light
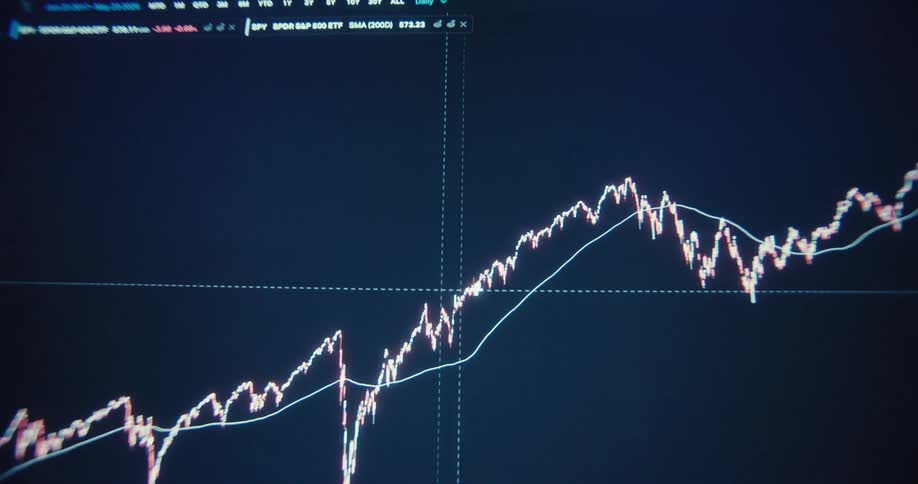
Candlestick chart of ETF or exchange-traded fund with steady growth and positive price performance over a long time span or years as the price of the asset steadily increases with an uptrend and successful value development symbolizing good investment
Coins fly up into the air
Pixelated macro close-up of a digital screen showing the user interface of an online trading platform or finance app or broker application displaying a candlestick chart or graph with green candles as the price increases and goes up with a positive trend
Red falling trading chart of an online stock broker or crypto exchange in a downward trend during a bear market crash and financial crisis symbolizing failure bankruptcy insolvency and losses caused by declining international and global economy
A blurry, abstract animation of a candlestick chart showing stock market or cryptocurrency volatility on a digital screen
A closeup shot shows a digital financial chart with red and green candlestick graphs on a black background the camera pans slowly to the right showing the bars moving up and down to reflect market changes
A chart moves around on the computer screen
Digital pixelated graph with positive trendline going up showing growth and financial strength of the global or US economy or an economical upward trend while making progress and profiting from business opportunities
Screen displaying bearish financial market graph as candlestick chart crashes while stock and crypto currency markets decline and assets lose their value due to drastically decreasing and falling prices causing panic sales and recession with volatility
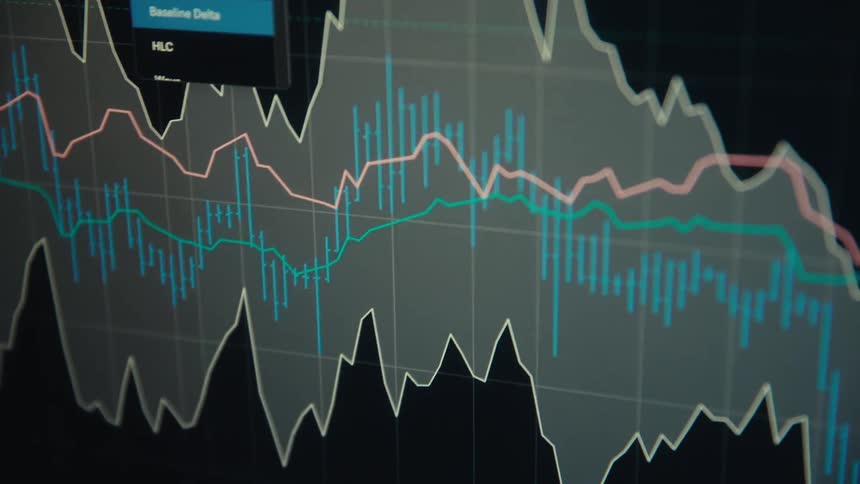
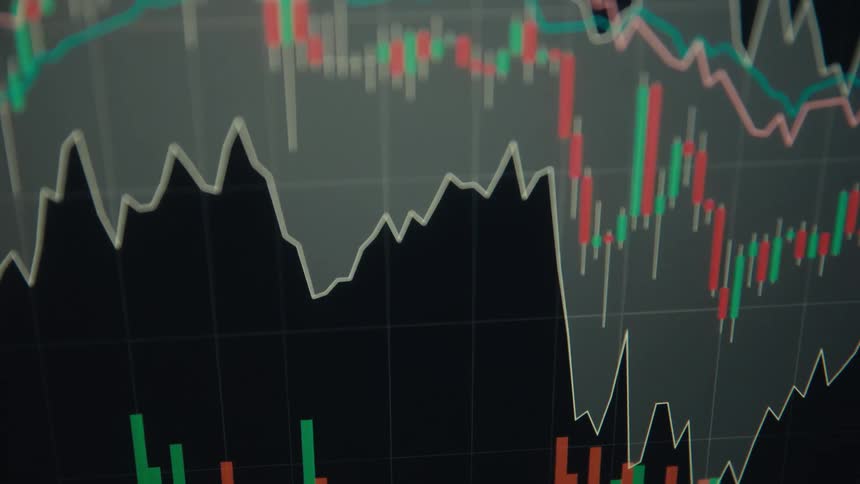
Multiple lines and a candlestick chart occupy the same graph on a digital screen as a selection is made
Green numbers fluctuate rapidly on a dark stock market ticker screen, displaying real-time financial trading data
Dollar bills flutter through the air against a dark background
Coins are tossed up in the air and fall back down against a black backdrop
View of a solar eclipse
A macro close-up of a digital stock market graph showing a bearish trend with a declining arrow indicating a financial crisis
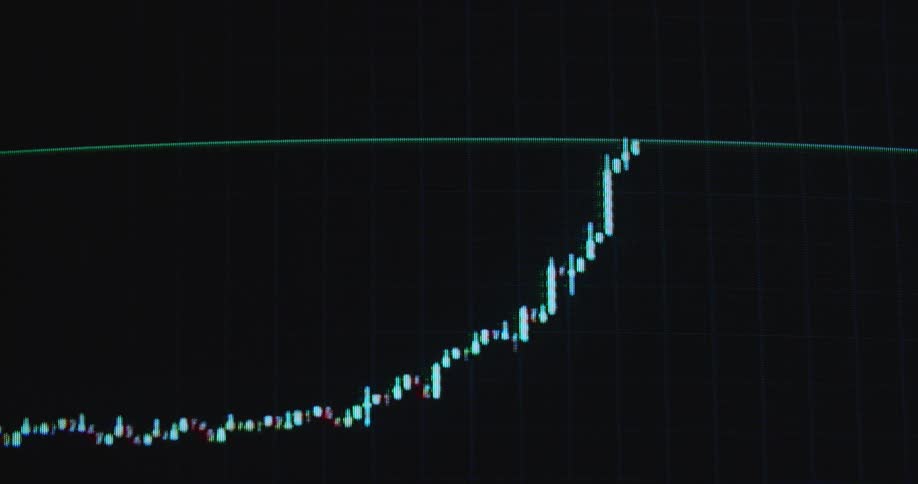
Pixelated RGB computer or display device screen presenting a candlestick trading chart with positive exponential price development as the green candles go up indicating a healthy global economy and stock market reaching new all-time highs
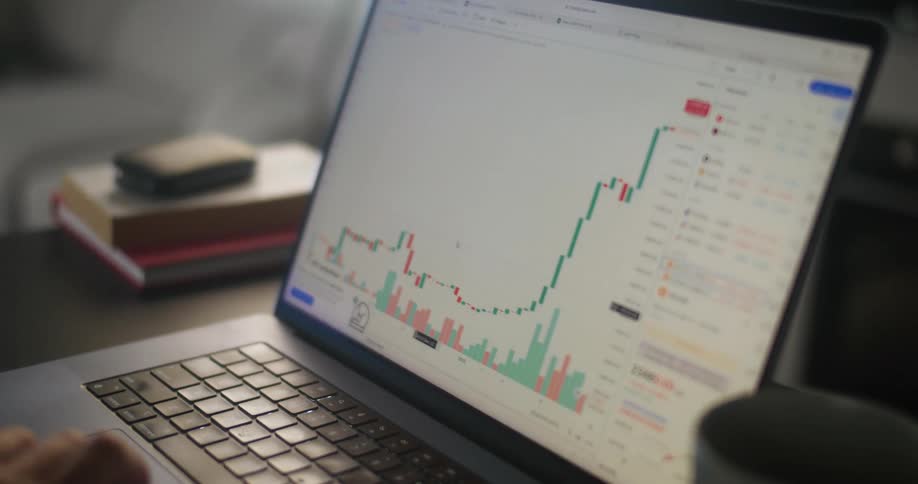
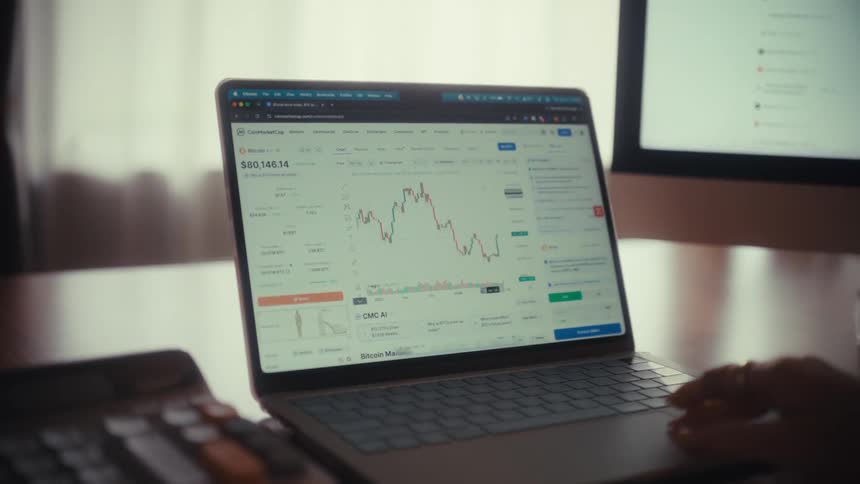
Close-up dolly out from a laptop screen showing a cryptocurrency price chart to reveal a person working and trading from their home office
Price variation chart with a red line followed by a green line over time
A pixelated smartphone or display device screen or monitor shows the user interface of a finance app or online broker and trading platform for buying and selling stocks and crypto currencies such as Bitcoin or ETH as the trading chart moves up
Rocket rising into the sky releasing fire and smoke
Closeup of a computer screen displaying realtime stock market charts and financial data
A pile of cash is on fire
Over-the-shoulder view of a person using a laptop to analyze stock market or cryptocurrency charts
Candlestick and line charts display variations on a financial panel

Need help finding the
right footage?

Have it delivered to your account within 1 business day.

This is Filmsupply

Our StoryOur FilmmakersArticlesFilmsPopular SearchesAll Categories

FM

A family of brands dedicated to empowering the creative.

FILMSUPPLY

Footage licensing for productions

MUSICBED

Music licensing for filmmakers

STILLS

Image licensing for creatives

© 2026 FM LLC.

Privacy PolicyLicense TermsTerms & ConditionsCareers