Musicbed
Filmsupply
Stills
Contact Us(800) 805-6802
Stocks scrolling vertically on a screen
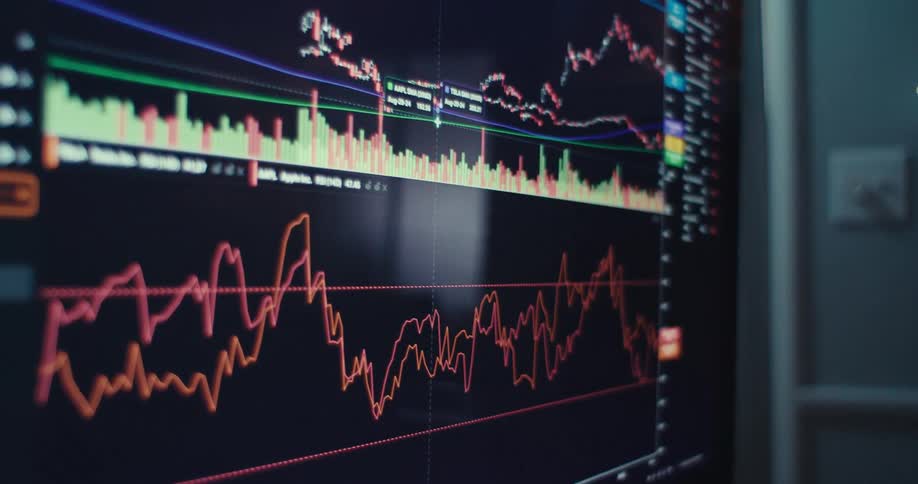
Blue and orange financial chart lines displayed on a digital screen
Green numbers fluctuate rapidly on a dark stock market ticker screen, displaying real-time financial trading data
A closeup shot of a screen displaying fluctuating stock market graphs and numerical data
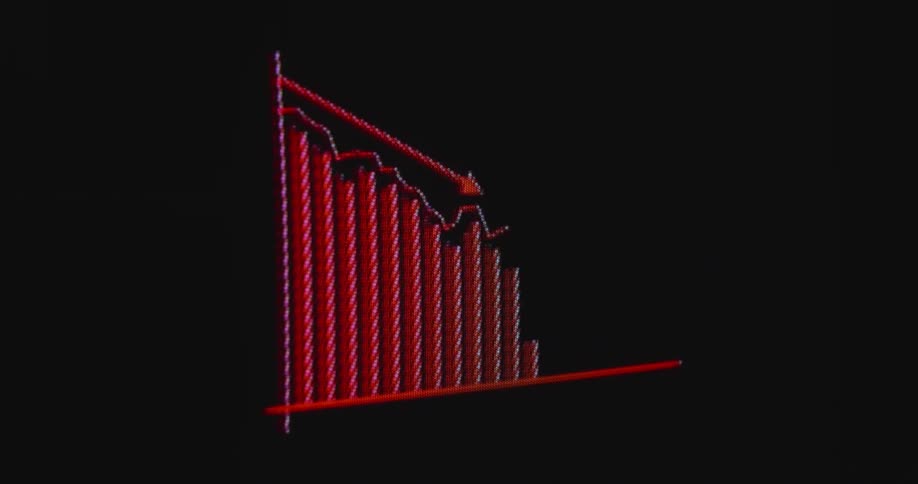
An extreme close-up, pixelated view of a red financial graph with a downward arrow indicating a stock market crash and economic decline
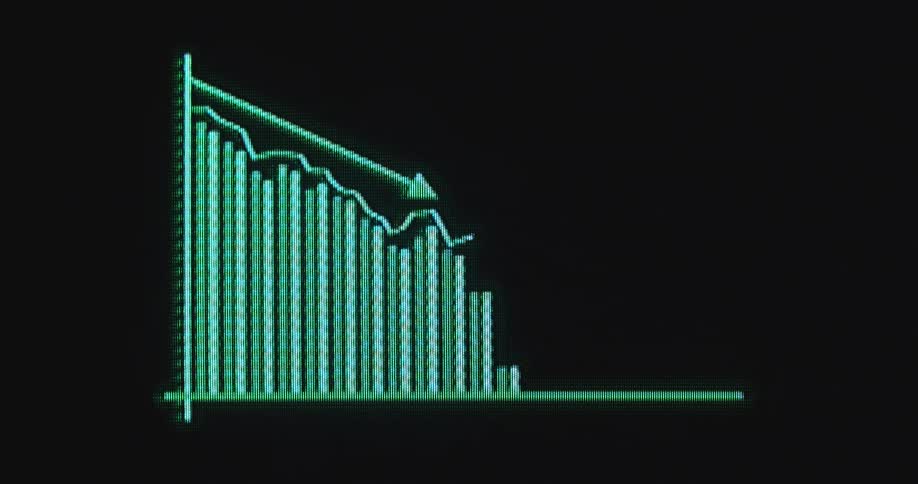
The animated data graph steadily goes down with a negative trend or declining tendency on the pixelated monitor presenting a financial or business statistic during a cooperate presentation with a holographic overlay or effect
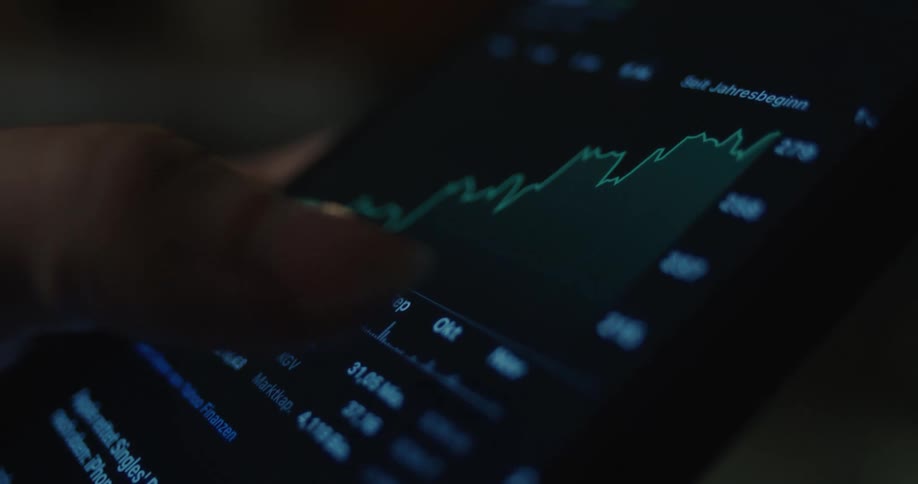
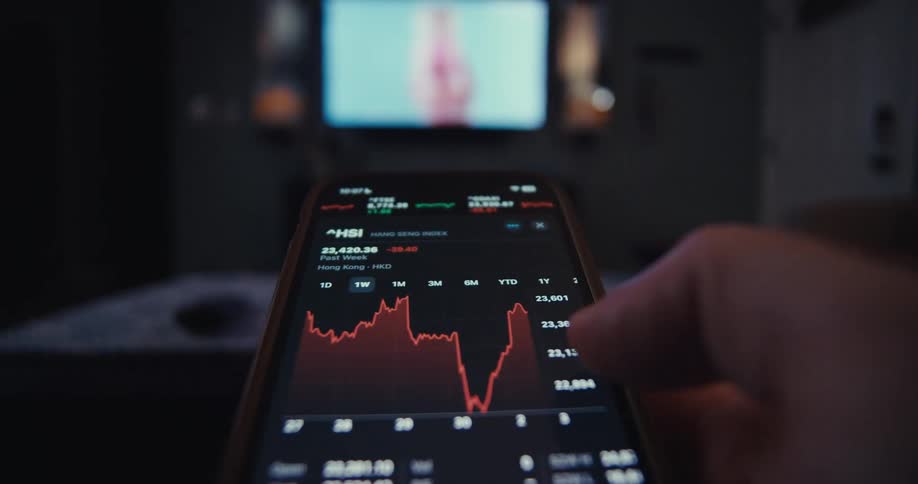
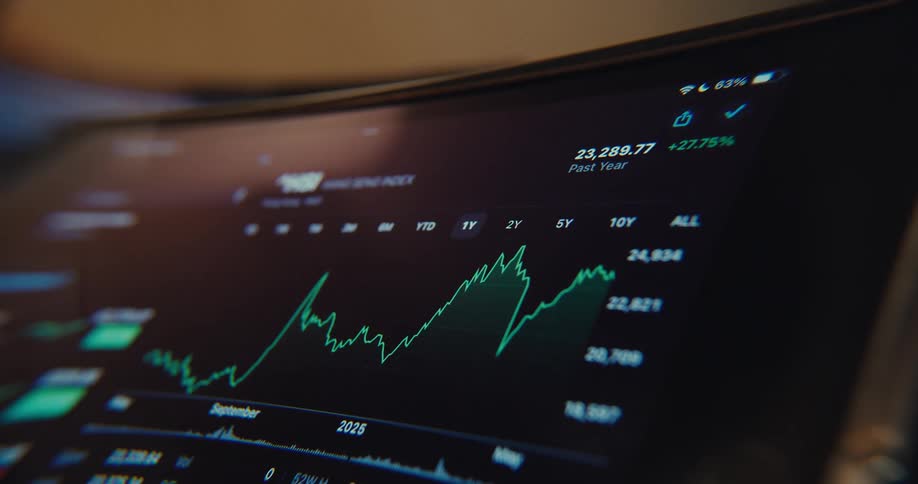
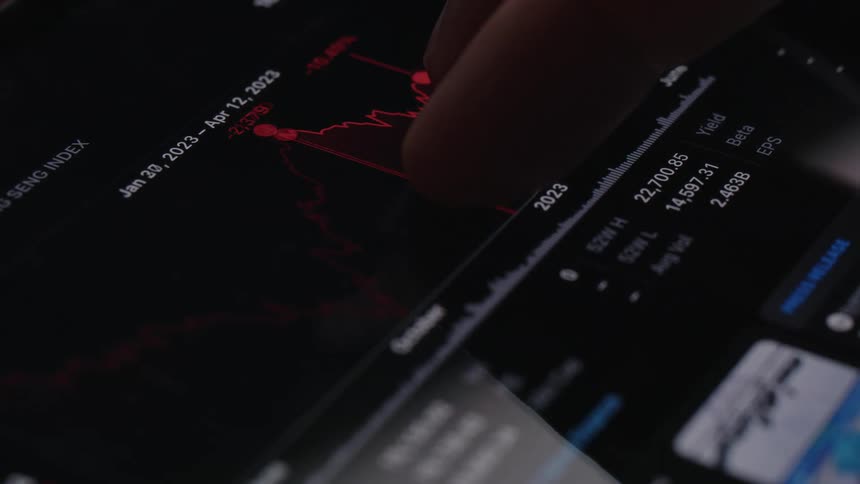
A closeup of a persons hand shows their thumb touching a smartphone screen displaying a financial line graph for the stock market
Dramatic macro close up with shaky camera movement of a screen showing animated financial trading chart or business statistic with negative outlook prediction or development in neon green retro colors
Close up view of a person looking at their phone
Graphs flash on the screen
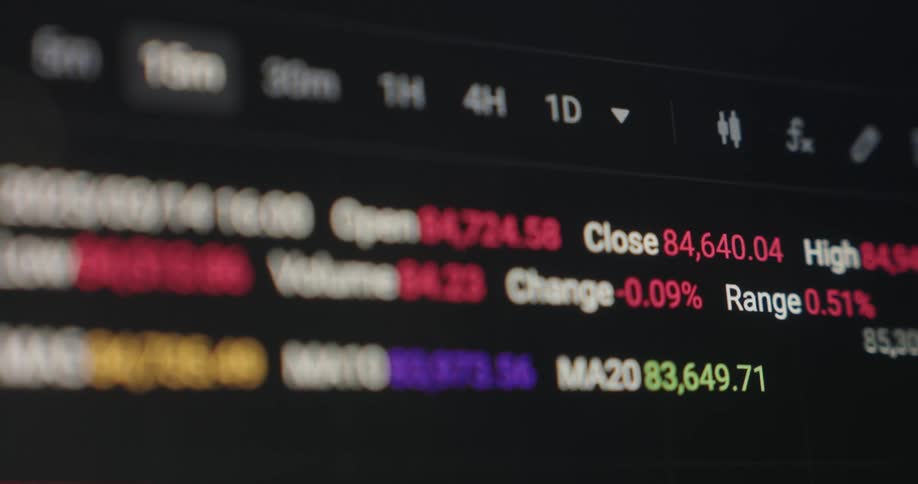
A footage of a trading chart screen
Reflection on a screen partially obscures a candlestick chart
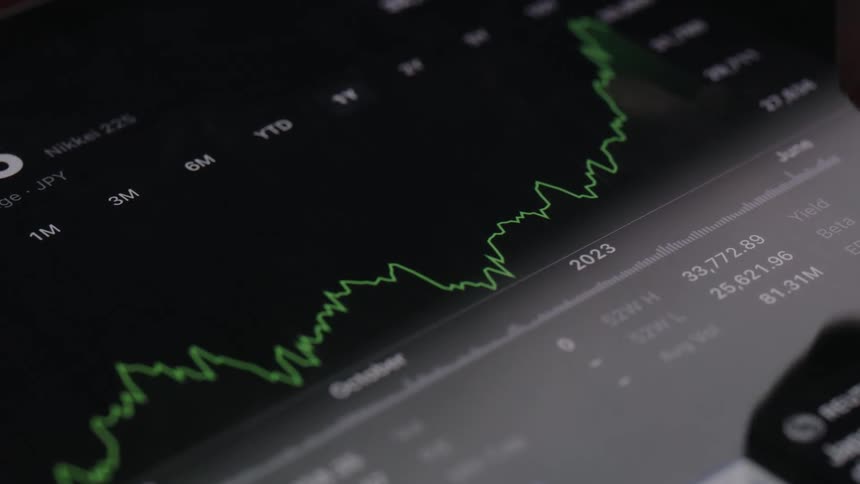
Finger touches a smartphone screen displaying a line financial chart on a dark interface
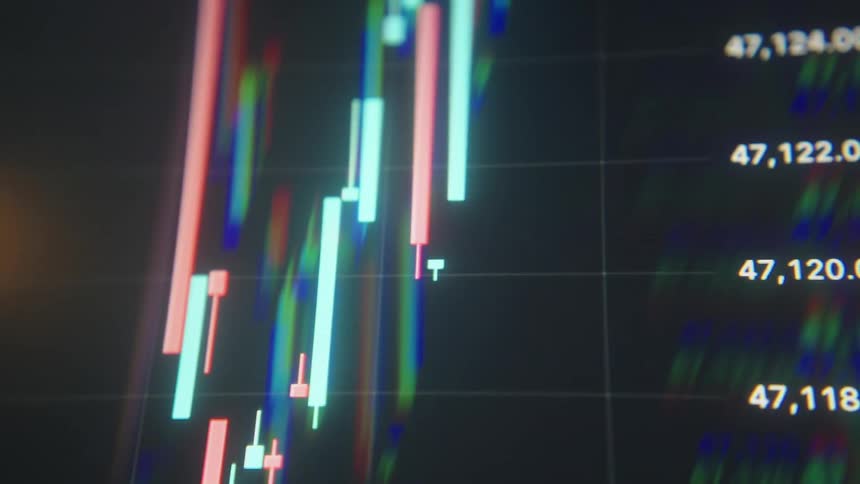
A closeup view of a stock market chart with red and green candlesticks fluctuating
Finger pointing at a market line chart displayed on a digital screen
An animated digital line graph shows a volatile stock price rising and falling, changing color from green to red to signify losses
Flames flicker in a group of holes
Red candlestick charts indicate sharp market downturn with fast price movement and negative development caused by stock or finance market crash and recession displayed on digital computer screen causing stress and panic while assets lose value
A screen shows a financial chart with lines and bars moving up and down
Candlestick and line charts display variations on a financial panel
A stock chart on a computer screen
A close up of numbers and charts on a screen
A close-up of a digital stock market chart shows fluctuating asset prices with candlestick patterns and changing numbers
A candle diagram graph plots an array of data on a pixel screen with numbers representing rising and falling real estate prices or changes in the stock market or crypto currency finance sector
A macro close-up of a digital stock market graph showing a bearish trend with a declining arrow indicating a financial crisis
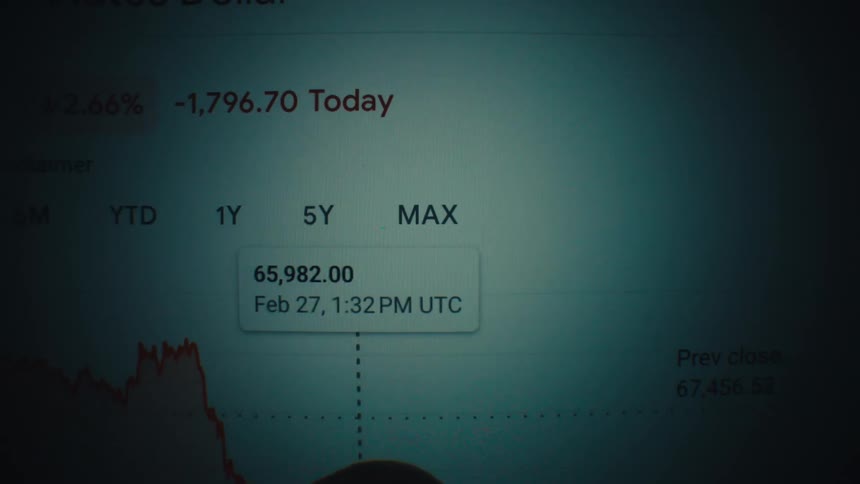
A financial chart on a screen shows a sharp daily drop highlighting market volatility and loss
Several wet golden coins with the bitcoin logo printed on them
Sharp decline shown in a financial chart animation played on a pixelated CTR computer screen as symbol for the financial crisis of the global economy in a dramatic downward trend with negative tendency as the numbers decrease
A finger swipes along a tablet
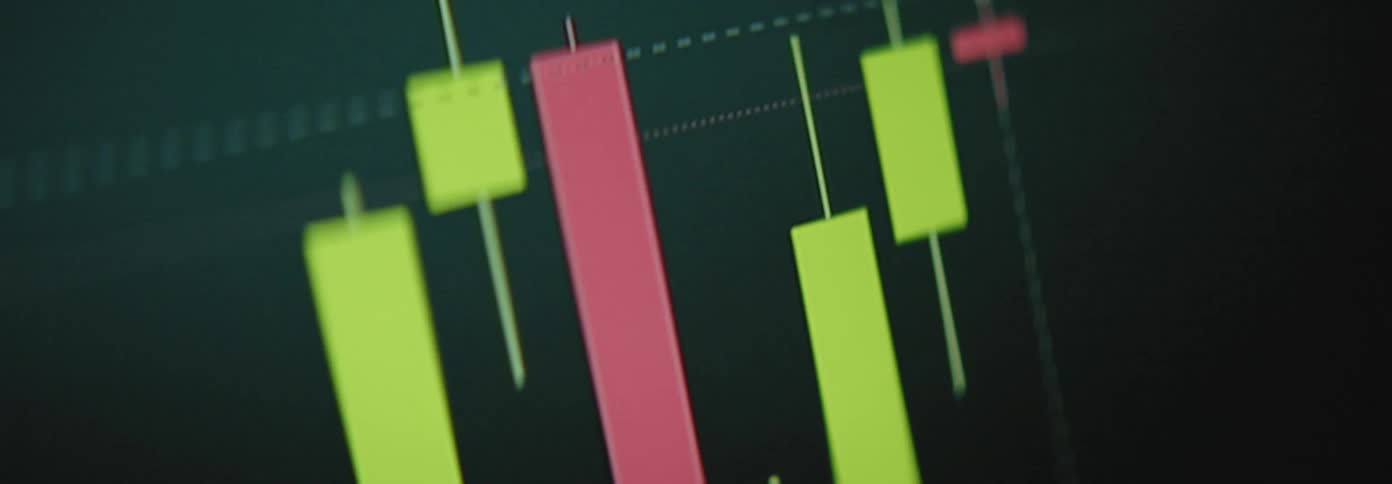
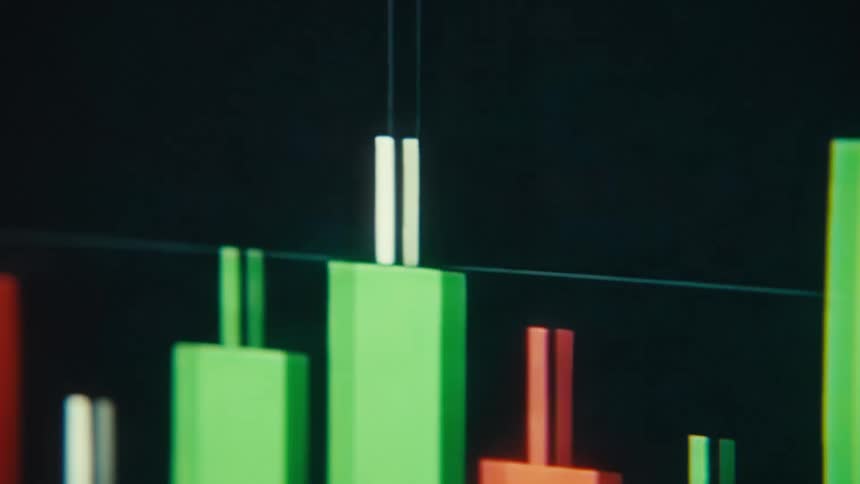
Tall green candlestick bars with thin white wicks rise against a dark background their sharp tops and bottoms hinting at sudden bullish spikes and shortterm volatility
A graph screen with pink and green bars
Computer monitors are showing graphs and data
A line graph is on the computer monitor
A computer screen displays fluctuating stock market charts and trading data
Pixelated computer screen showing animated data in red trend line graph with negative downward movement symbolizing the stock market crash from 1987 or any other financial crisis causing a meltdown of the global economy
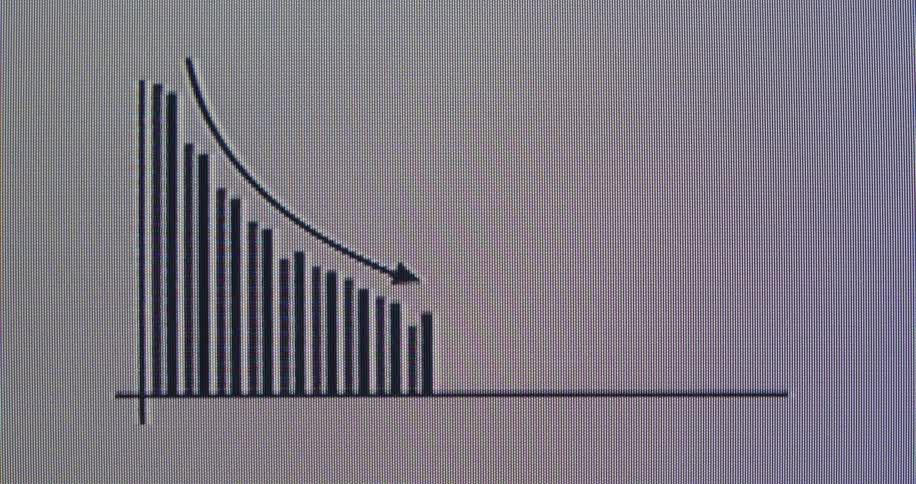
A close-up of an animated bar graph on a pixelated computer screen showing a declining trend
In a dimly lit room a finger scrolls through a fluctuating red stock market graph on a smartphone with a television glowing in the background
A neon green coloured sales chart or finance trading graph showing a downward trend symbolising a financial meltdown or a market crash or collapse caused by economic uncertainties and fear of global recession
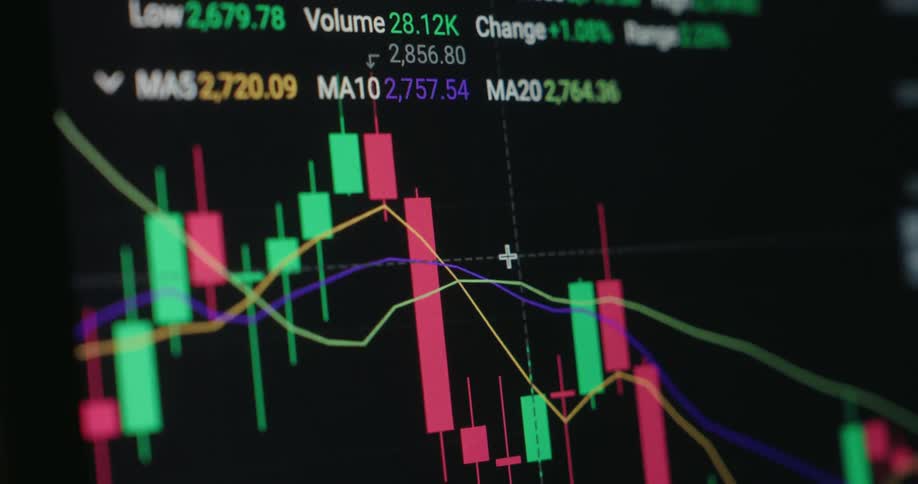
A computer screen displaying a stock market candlestick chart with fluctuating red and green lines indicating market trends
Person scrolls through stock information on a tablet
A computer screen with a green graph on it
Financial candlestick chart against a gray screen
Closeup of a newtons cradle with polished metal balls in motion in a dark studio
A financial trading graph with colorful lines displaying market trends
A finger scrolling on aglowing market chart on a screenthat shows fluctuating prices with sharp dips and recoveries
A digital graph on a screen shows a volatile stock price or cryptocurrency value fluctuating up and down, indicating gains and losses
The graphic has holes with flames
The financial markets are crashing due to a recession making stocks and shares drop and go down in price with decreasing value symbolized by a falling candlestick chart with red candles on a RGB pixel screen with black background
Series of candlestick stock prices displayed on a screen
Multiple lines and a candlestick chart occupy the same graph on a digital screen as a selection is made
Green line displays digital information against a black background
A close view of a glowing computer screen displays colorful digital stock market charts and data with motion blur and light leak effects across the frame
Person touching a screen of an electronic device
Futuristic closeup of a computer screen displaying a stock market graph or candle chart with ups and downs and upward tendency representing the digital and modern finance sector
A bar and line graph shows an upward trend with an arrow emphasizing growth and increasing savings on the bank account for a solid retirement due to a successful pension plan and long-term investment strategy
Finger points to a highlighted value on a financial chart displayed on a screen
Water flowing over gold coins
A macro view of a digital screen shows a black animated graph with a falling line chart and a downward pointing arrow overlaying vertical bar charts representing a market decline or financial loss on a white background
A finger scrolls through a touchsceen
Computer screen displaying a series of candlestick stock prices with green and red candles
Red line chart shows variation of financial values over time
Close up of an electronic screen displaying a trading interface in white and black
Extreme closeup of a digital screen with coins falling into a piggy bank icon as symbol for a savings account on an online banking platform or finance application

Need help finding the
right footage?

Have it delivered to your account within 1 business day.

This is Filmsupply

Our StoryOur FilmmakersArticlesFilmsPopular SearchesAll Categories

FM

A family of brands dedicated to empowering the creative.

FILMSUPPLY

Footage licensing for productions

MUSICBED

Music licensing for filmmakers

STILLS

Image licensing for creatives

© 2026 FM LLC.

Privacy PolicyLicense TermsTerms & ConditionsCareers