Musicbed
Filmsupply
Stills
Contact Us(800) 805-6802
A close-up view of an animated scientific scatter plot displaying complex protein data on a computer screen
A candlestick chart showing a stock price rising with green candles indicating upward movement while the Dow Jones or MSCI World ETF increases in value and price symbolizing a strong US economy and healthy global financial markets
Different frequencies and amplitudes of sound waves shown on a display
A close-up of a social media live view counter rapidly climbing into the millions, showing the video going viral
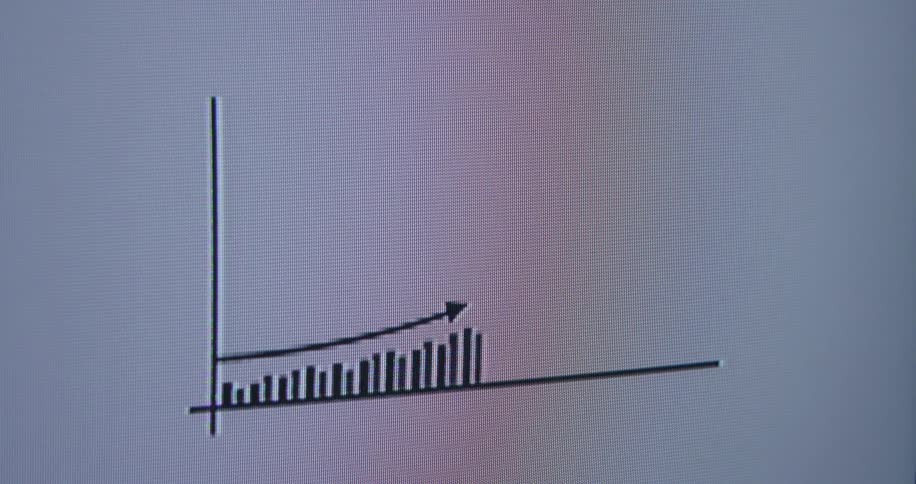
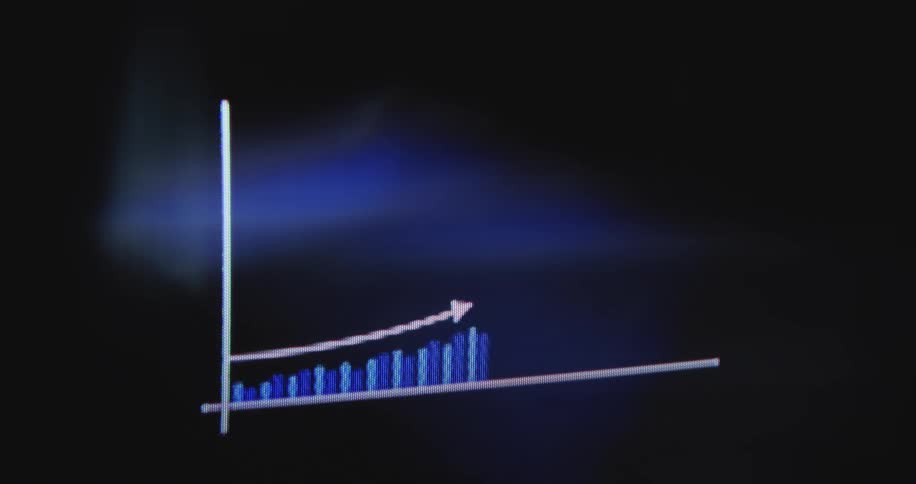
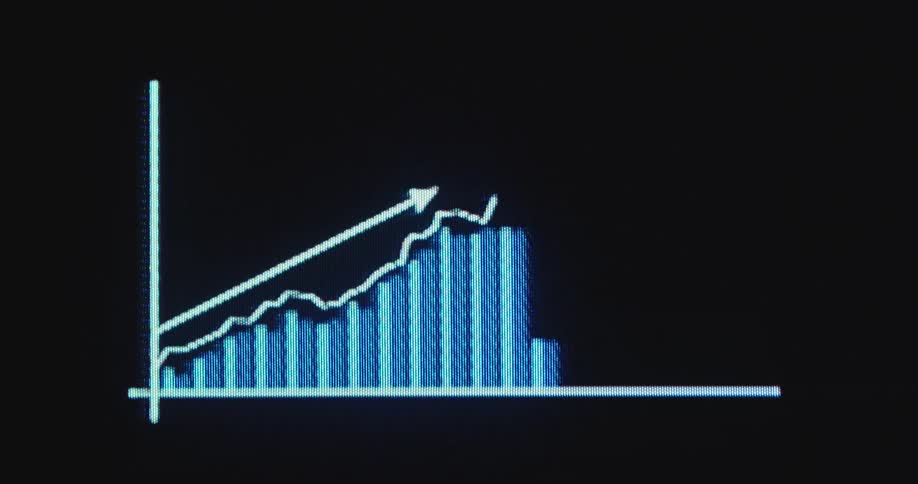
Close-up of a pixelated screen showing an animated bar graph with a positive upward trajectory
A dark screen displays fluctuating blue and red line graphs trending downward and upward against a gridlike background
A finger scrolling on aglowing market chart on a screenthat shows fluctuating prices with sharp dips and recoveries
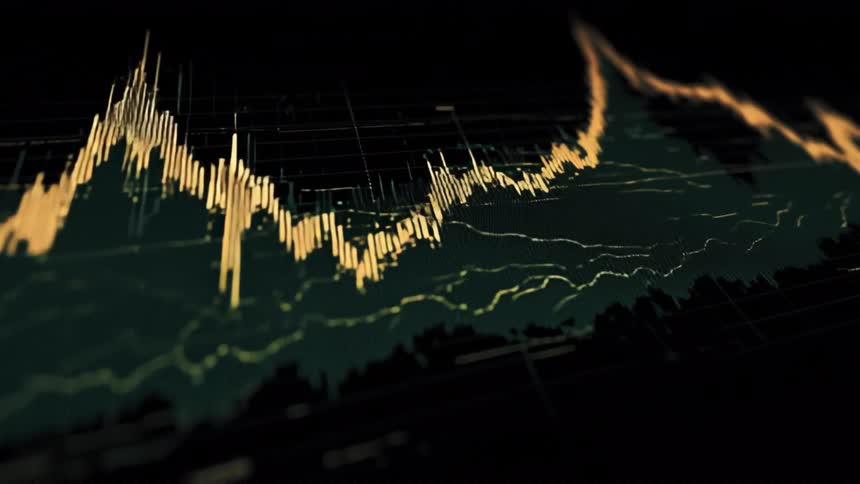
An angled closeup shot captures the dramatic peaks and valleys of a digital financial analytics chart with glowing yellow and green lines
Futuristic closeup of a computer screen displaying a stock market graph or candle chart with ups and downs and upward tendency representing the digital and modern finance sector
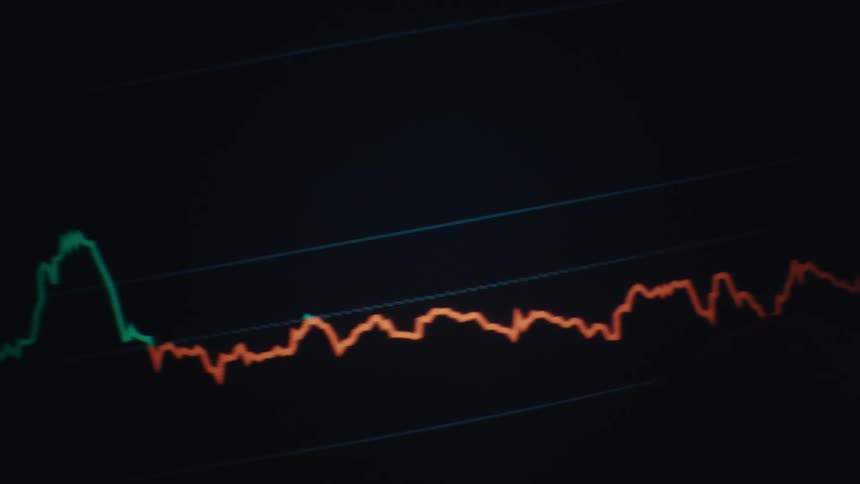
Price variation chart with green and red lines showing financial values
A distorted, fisheye view of a computer screen shows a user interacting with a colorful 3D scatter plot, analyzing scientific data
Reflection on a screen partially obscures a candlestick chart
Close up of an electronic screen displaying a trading interface in white and black
Graph and numbers moving on the screen of a smart phone
A simple digital bar chart on a black screen animates to show progressive growth and success
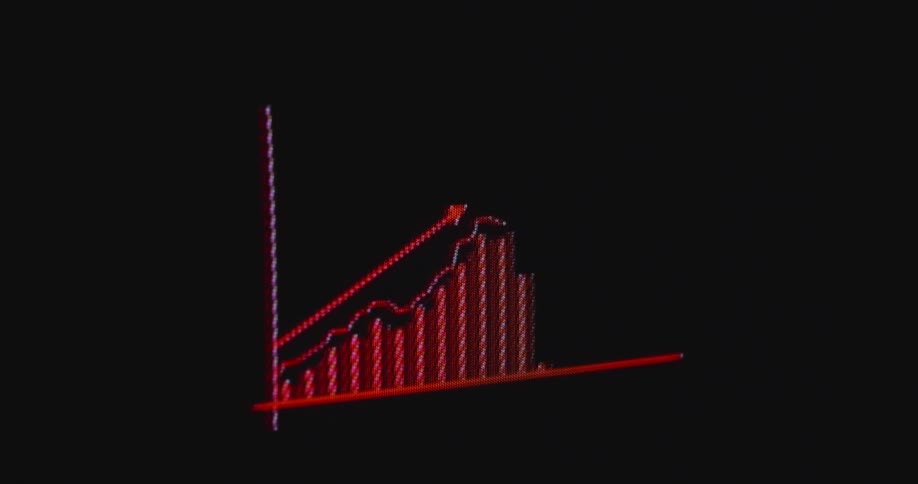
Wide angle shot of a pc screen that displays a red chart with an arrow rising from left to right while prices increase and the inflation rate keeps going up while the economy is fearing a recession as the fiat money system collapses
Close up of digitized trend line graph moves up and down on the smartphone screen or computer monitor as symbol for volatility of the finance industry business and share market that requires good investment strategies to successfully earn money
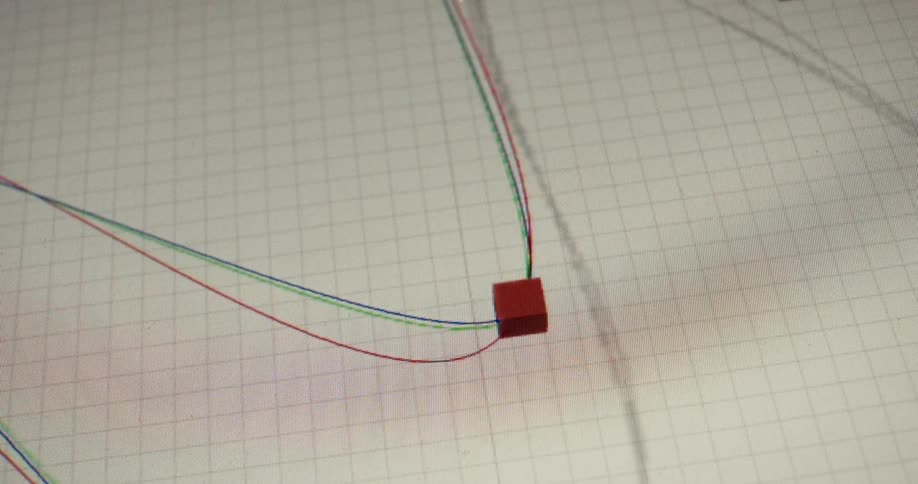
A designer manipulates anchor points and splines on a computer screen while working in a 3D animation program
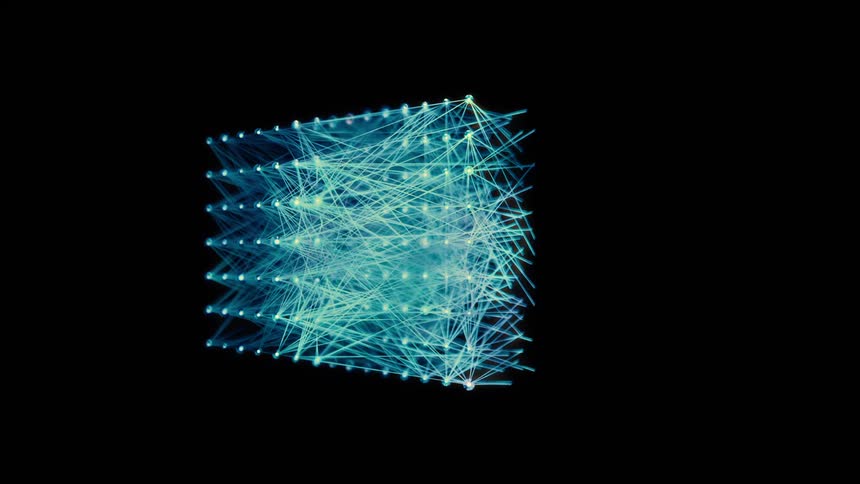
Orbit Shot of a Blue AI Neural Network - Abstract Data Flow - Machine learning - Nodes and Lines
Closeup of a screen displaying a stock market chart
Animated 3D scatter plot with rainbow-colored data points being analyzed on a computer screen with a futuristic interface
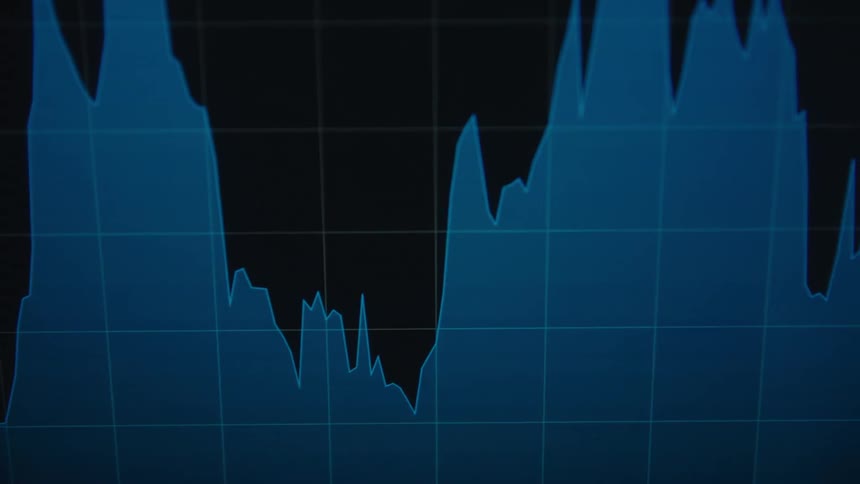
Blue colors the area under the line in a graph contrasting with the black background on a computer screen
White and blue lines
A live view counter on a digital screen rapidly increases, showing a video going viral and reaching over a million views
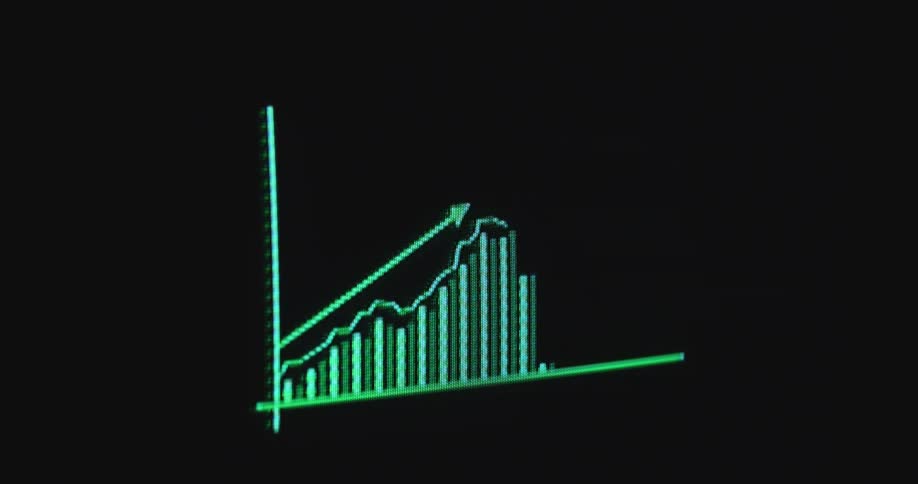
A retro-style green bar chart on a black computer screen shows exponential growth, with an upward-pointing arrow
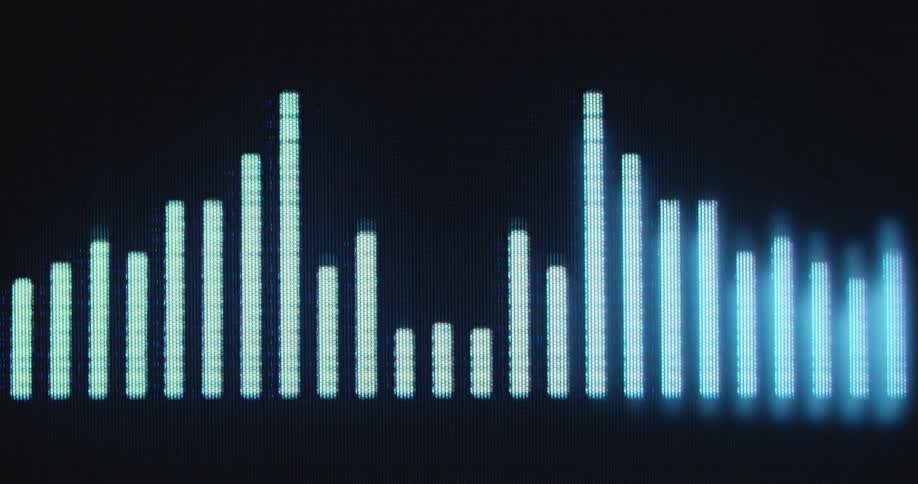
The colourful 2D animation of an equalizer screen displaying the sound bars moving in front of dark background with bright neon light and contrast as a symbol or visualization of the sound of audio files or recordings
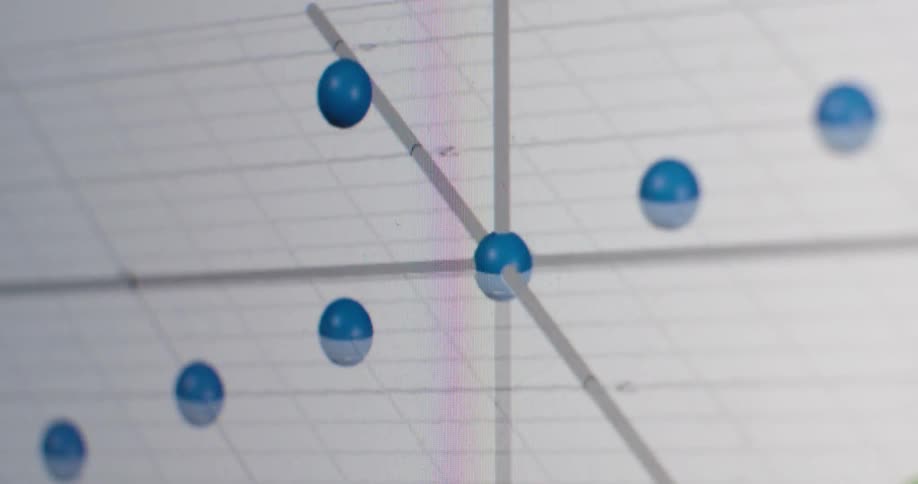
An abstract animation of a rotating 3D scatter plot shows dynamic blue data points on a coordinate grid
Screen displaying a dimensional color graph
Overlapping line and candlestick charts display intense financial fluctuations
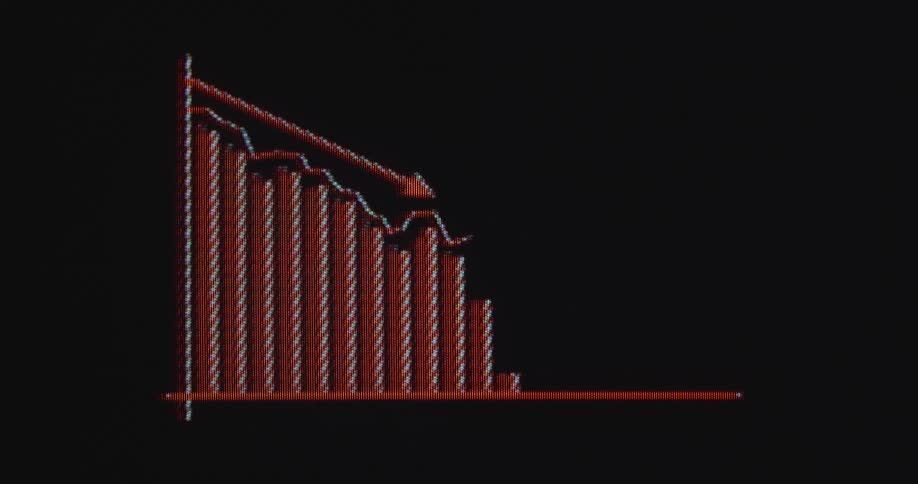
Extreme close-up of a digital screen displaying a bar graph with a downward-trending arrow, indicating a financial decline or market crash
Screen displaying candle chart
Bright neon green bars or candles of a candlestick chart pattern or financial graph on computer display screen with dark background and positive price development symbolizing successful stock trading with upward trend and handheld camera movement
Digital candlestick charts hover over a swiftly moving surface of black streaked with blue and orange shades
Close-up of a digital bar graph showing financial growth with increasing dollar values in millions
Digital black and white screen shows an animated graph with a rising line chart and vertical bars growing upward to indicate business development or financial investment success during a cooperate presentation with holographic overlay
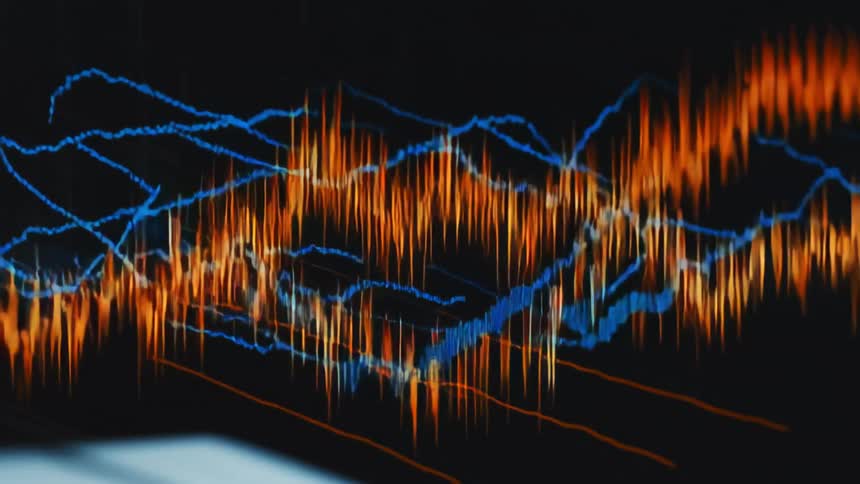
Blue and orange financial chart lines displayed on a digital screen
Graph of the price of a currency
The screen is full of line graphs
A digital investment graph trend line shifting between going up and down as a stock trading market prognosis or index of the finance sector affected by the global economy in the darkness on black flickering retro computer screen
A computer screen with a green graph on it
A neon turquoise line moves in a zig zag pattern on a dark background
Price chart of a stock displayed on a screen
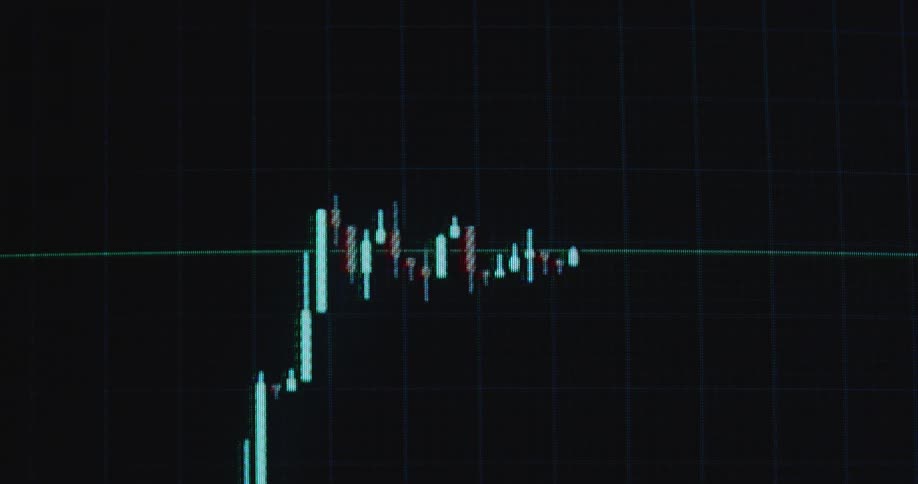
A computer monitor displays a stock market candlestick price chart
Graphs flash on the screen
A blue and white graph or chart animation presents successful business data and a growing economy as the arrow moves upward with a positive price development due to healthy financial markets
Glowing red bar graph with a declining line arrow is displayed on dark background while the financial trading chart is crashing and the market is in a negative down trend causing critical stress and economic downturn with red figures
A green waveform with a bright pulsing light moves across a dark screen with a grid pattern
Close up of pixelated investment graph going up during an upward trend as a symbol for rising stock market and financial freedom and success during economic growth on an old TV or computer screen showing a finance app
People walk by the line graph on the monitor
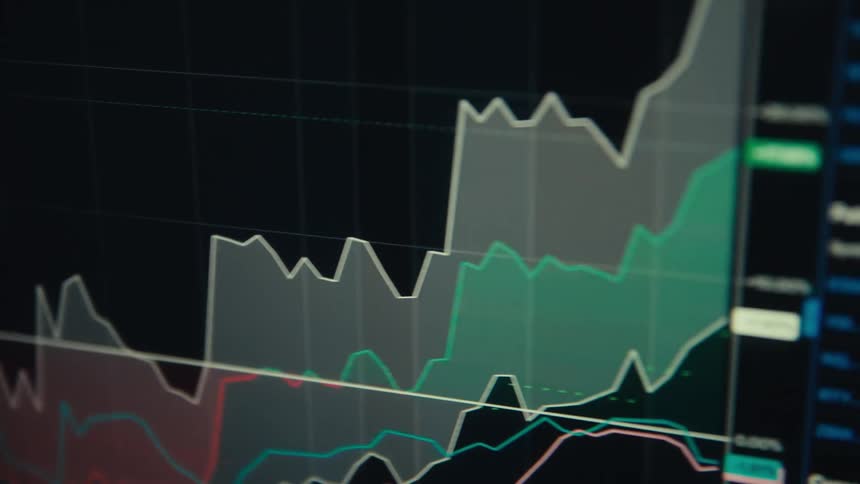
A screen shows a financial chart with multiple lines and bars that fluctuate
The green pixels of a retro display device show the tips of sound bars from a 2D equalizer motion graphic animation as the sound waves move up and down with the different frequencies
A screen with red and blue graphs
Cardiac event monitor displaying a yellow heartbeat line moving up and down on a dark screen
A line on a graph moves up and down as it travels across a screen
Computer broker screen displaying a green rising graph animation or trading chart visualizing constantly increasing ETF or Exchange Traded Fund prices such as the MSCI World DAX Dow Jones or S&P 500
Audio studio voice recording sound wave on a computer screen with different frequencies and tones as the audio level indicator bars of the equalizer interface move up and down to the music beat or song
A macro shot shows a 3D data plot with blue spheres rotating on a digital screen, with a fast-moving clock overlay
A line graph is on the long monitor
A wall made up of animated graphs
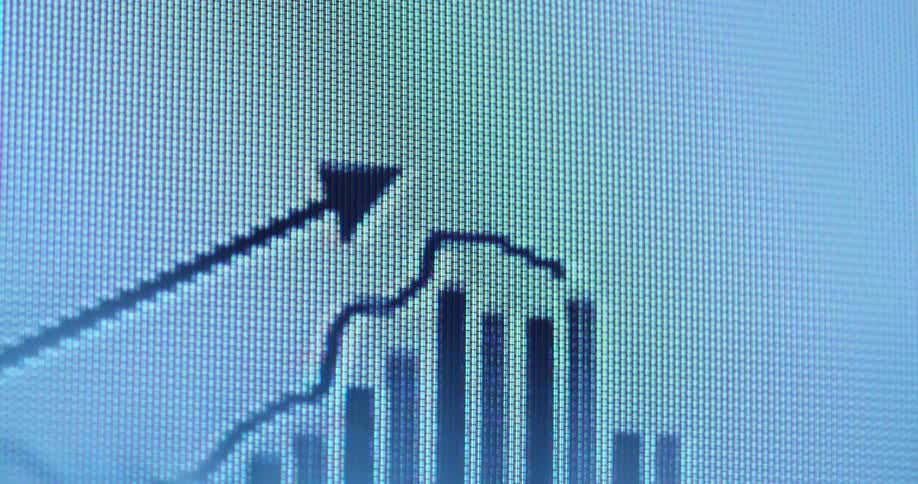
Macro close-up view of a digital screen shows an animated graph with a rising line chart and an upward pointing arrow overlaying vertical bar charts representing market growth or financial success on a white computer screen background
Blue lines crisscross along a screen
Financial candlestick chart showing strong upward movement after Bull Flag breaks resistance to the upside and bullish price action continues during massive crypto bull run and alt coin season creating generational wealth among investors and traders
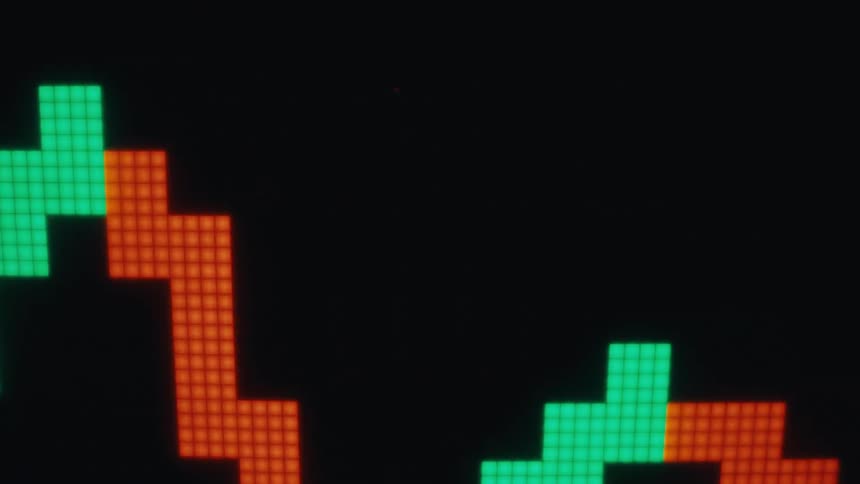
Pixelated zigzag line with green and red blocks on black background

Need help finding the
right footage?

Have it delivered to your account within 1 business day.

This is Filmsupply

Our StoryOur FilmmakersArticlesFilmsPopular SearchesAll Categories

FM

A family of brands dedicated to empowering the creative.

FILMSUPPLY

Footage licensing for productions

MUSICBED

Music licensing for filmmakers

STILLS

Image licensing for creatives

© 2026 FM LLC.

Privacy PolicyLicense TermsTerms & ConditionsCareers