Musicbed
Filmsupply
Stills
Contact Us(800) 805-6802

Analyzing Data Stock Video Footage

Licenses 3097 high quality Analyzing Data stock video clips in 4K, raw formats

Binary Tech And Computers

Evolve

Studio Binary Man

Evolve

Macro close-up of the word "analyzing..." being typed onto a black computer screen, representing data processing
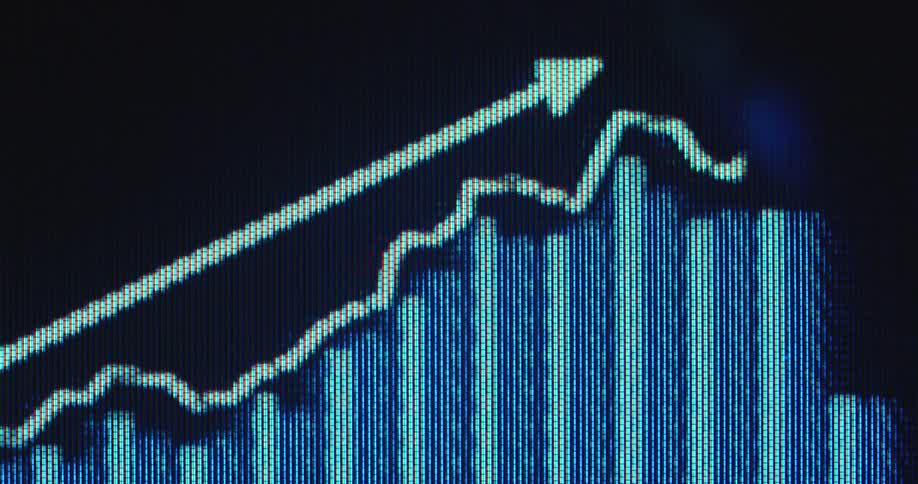
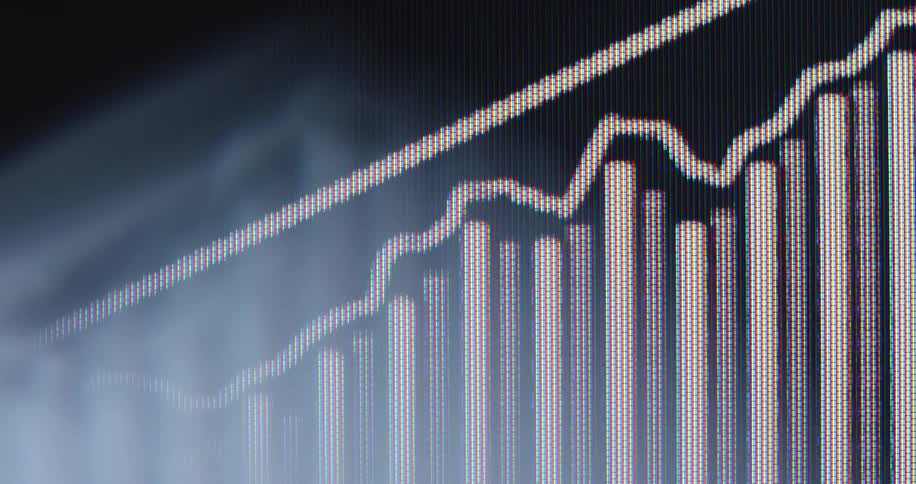
A bar and line graph shows an upward trend with an arrow emphasizing growth and increasing savings on the bank account for a solid retirement due to a successful pension plan and long-term investment strategy
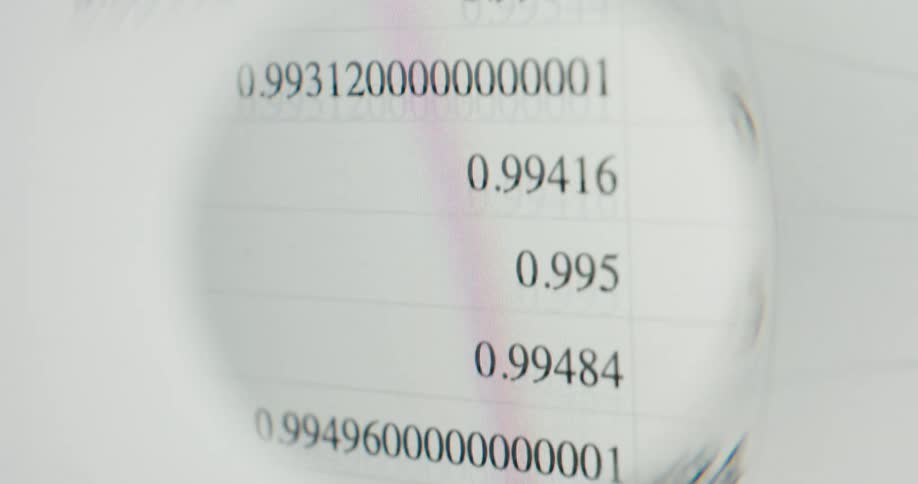
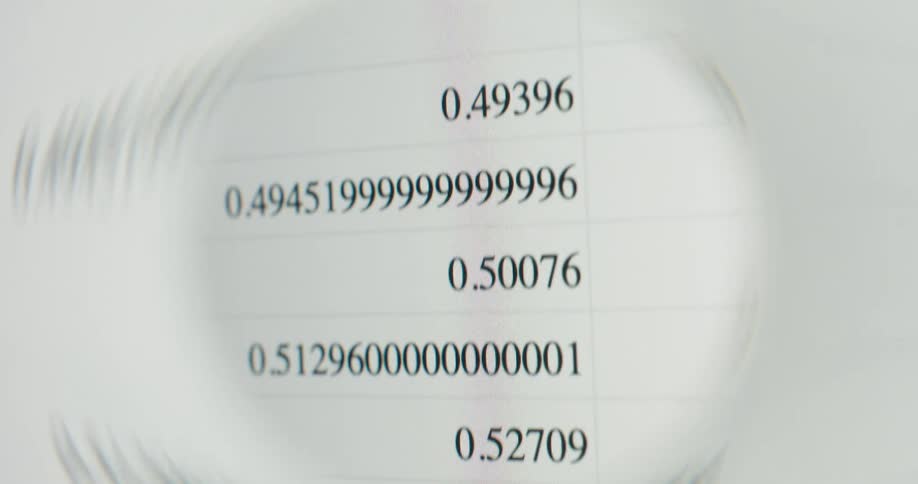
A magnifying glass scans down a column of decimal numbers on a spreadsheet, symbolizing data analysis and research
Snippet of code displayed on a computer screen
The video features a closeup cinematic shot of various financial data charts and candlestick graphs flickering across a digital screen it captures the fastpaced atmosphere of stock market trading through shifting focus and vibrant multicolored data v
Closeup of a digital trading graph with fluctuating lines and bars on a screen
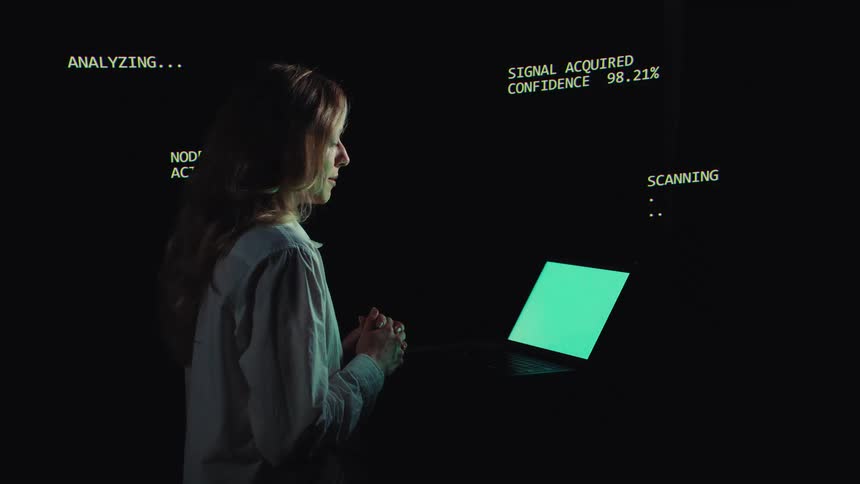
A woman in a dark room analyzes complex data on a green screen laptop as a futuristic holographic interface is projected onto the wall
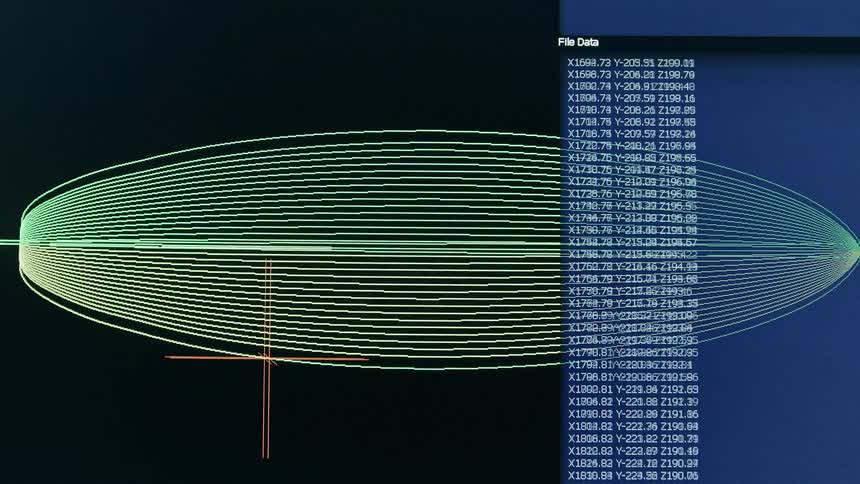
Digital modeling of a surfboard displayed with vector lines and numerical data
A stylized, out-of-focus close-up of a digital stock market chart showing fluctuating data with glowing lines
Multiple colorful lines move in an animated digital graph
Close up of a line graph on a screen under a blue light while the camera comes on and off focus
Abstract 2D animation displayed on a vintage computer or television screen showing the audio bars of an EQ or equaliser device of a stereo system or recording equipment in a sound studio while the lines move up and down
Abstract animation of a colorful 3D data scatter plot being analyzed with a distorted, looping effect
A close-up of a computer screen displays a 3D wireframe animation of a walking figure for motion capture analysis
Closeup of colorful programming code displayed on a computer screen
Overlapping line and candlestick charts display intense financial fluctuations
A black screen with various codes in different colors flashing by rapidly
A graph showing two lines and scattered dots
An abstract, out-of-focus animation shows a volatile candlestick chart with red and green bars moving on a digital grid
A display showing charts of a stock price
A person monitors frequently changing graphs on a screen
Macro close up of a red arrow that moves up across a pixelated screen as a financial trading graph is building beneath it symbolizing economic growth or rising stock prices or crypto currency trading as successful investment
A high-tech digital animation shows a fluctuating green line graph on a stock market or cryptocurrency exchange chart with data analysis overlays
Rows of zeros and ones scroll across a computer screen
A close-up macro view of a financial candlestick chart with red and green bars fluctuating on a digital screen
Price chart of a stock displayed on a screen
A pixelated display with numbers and blue circles
Cctv catches a man shining a flashlight on a bicycle
A colorful, stylized animation of a financial candlestick chart displays market volatility on a digital grid
A line graph is on the long monitor
Random light patterns
A financial graph with an upward trend arrow and bar chart rises on a digital screen, with smoke effects adding a mysterious atmosphere
A magnifying glass scans a column of decimal numbers on a spreadsheet, representing data analysis or financial information
Close up of a computer screen displaying a coding software interface
An extreme close-up of a digital display shows columns of rapidly changing financial or statistical data with visual glitches
A financial chart shows a volatile market trend with sharp rises and dips over time
Numbers are all over this wall
Colored lines and numbers appear on a blue screen with the look of a digital chart
A blurry, abstract animation of a candlestick chart showing stock market or cryptocurrency volatility on a digital screen
Financial charts with colored bars and lines displayed on a digital screen
This abstract clip features a colorful digital pattern that shifts and changes the bright colors including reds greens and blues move in waves and vertical lines reminiscent of a visualizer for a sound wave
The white sound wave bar animation jumps and moves up and down with the song while the music track or audio book is being recorded in a sound studio using vintage recording or hi-fi equipment with a pixel RGB screen
An interactive 3D data visualization scatter plot with colorful spheres is analyzed on a futuristic interface
Macro shot of a blue digital audio waveform or histogram graph being generated on a computer screen
Rapidly changing digital financial data scrolls across a screen in a dark, abstract view
Series of candlestick stock prices displayed on a screen
Blue static lines play on a television
A person is pointing to a chart on the monitor
A close-up, out-of-focus animated financial chart shows fluctuating stock market data with glowing lines and candlestick patterns
A graph of orange lines
Lines on a graph on a computer monitor
A green rising digital bar chart appears on the computer screen symbolizing financial freedom and success due to economical growth and an upward trend of the global economy and digital stock markets and crypto trading platforms
Macro close up shot of a colorful data visualization graph displaying scientific analysis on a computer screen
Closeup of a graph of financial data that occasionally shows spots of light
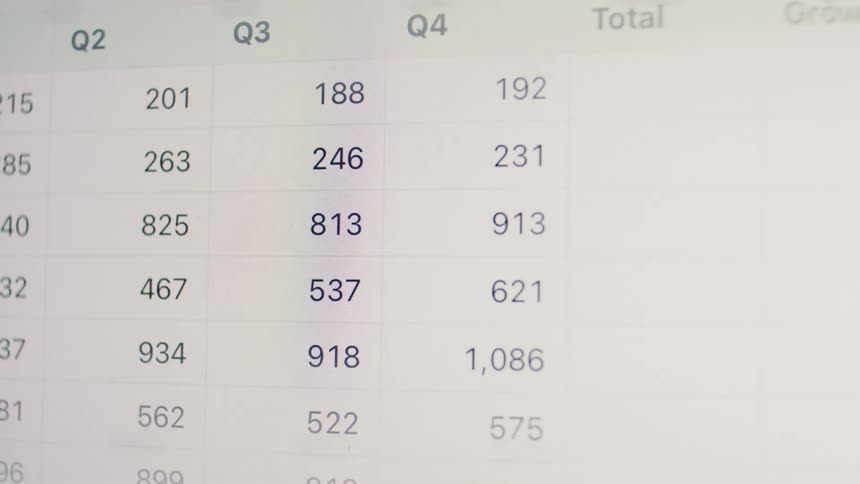
A close-up view of a spreadsheet on a computer screen being automatically populated with quarterly financial figures and totals
A screen shows a financial chart with lines and bars moving up and down
Multiple plots in blue and red are scrolled over against a black background
A display has flashing numbers
Stylized, soft-focus animation of a stock market or cryptocurrency trading chart with fluctuating data and glowing lines
An angled closeup shot captures the dramatic peaks and valleys of a digital financial analytics chart with glowing yellow and green lines
The monitor has graph lines displayed
Dynamic dramatic macro footage with shaky movement of a stock trading chart or data graph animation moving upwards with a positive trend line indicating a stock market or crypto bull run and the increase in value of different assets
A magnifying glass moves down a column of decimal numbers on a digital screen, suggesting data analysis or scrutiny

Need help finding the
right footage?

Have it delivered to your account within 1 business day.

This is Filmsupply

Our StoryOur FilmmakersArticlesFilmsPopular SearchesAll Categories

FM

A family of brands dedicated to empowering the creative.

FILMSUPPLY

Footage licensing for productions

MUSICBED

Music licensing for filmmakers

STILLS

Image licensing for creatives

© 2026 FM LLC.

Privacy PolicyLicense TermsTerms & ConditionsCareers